
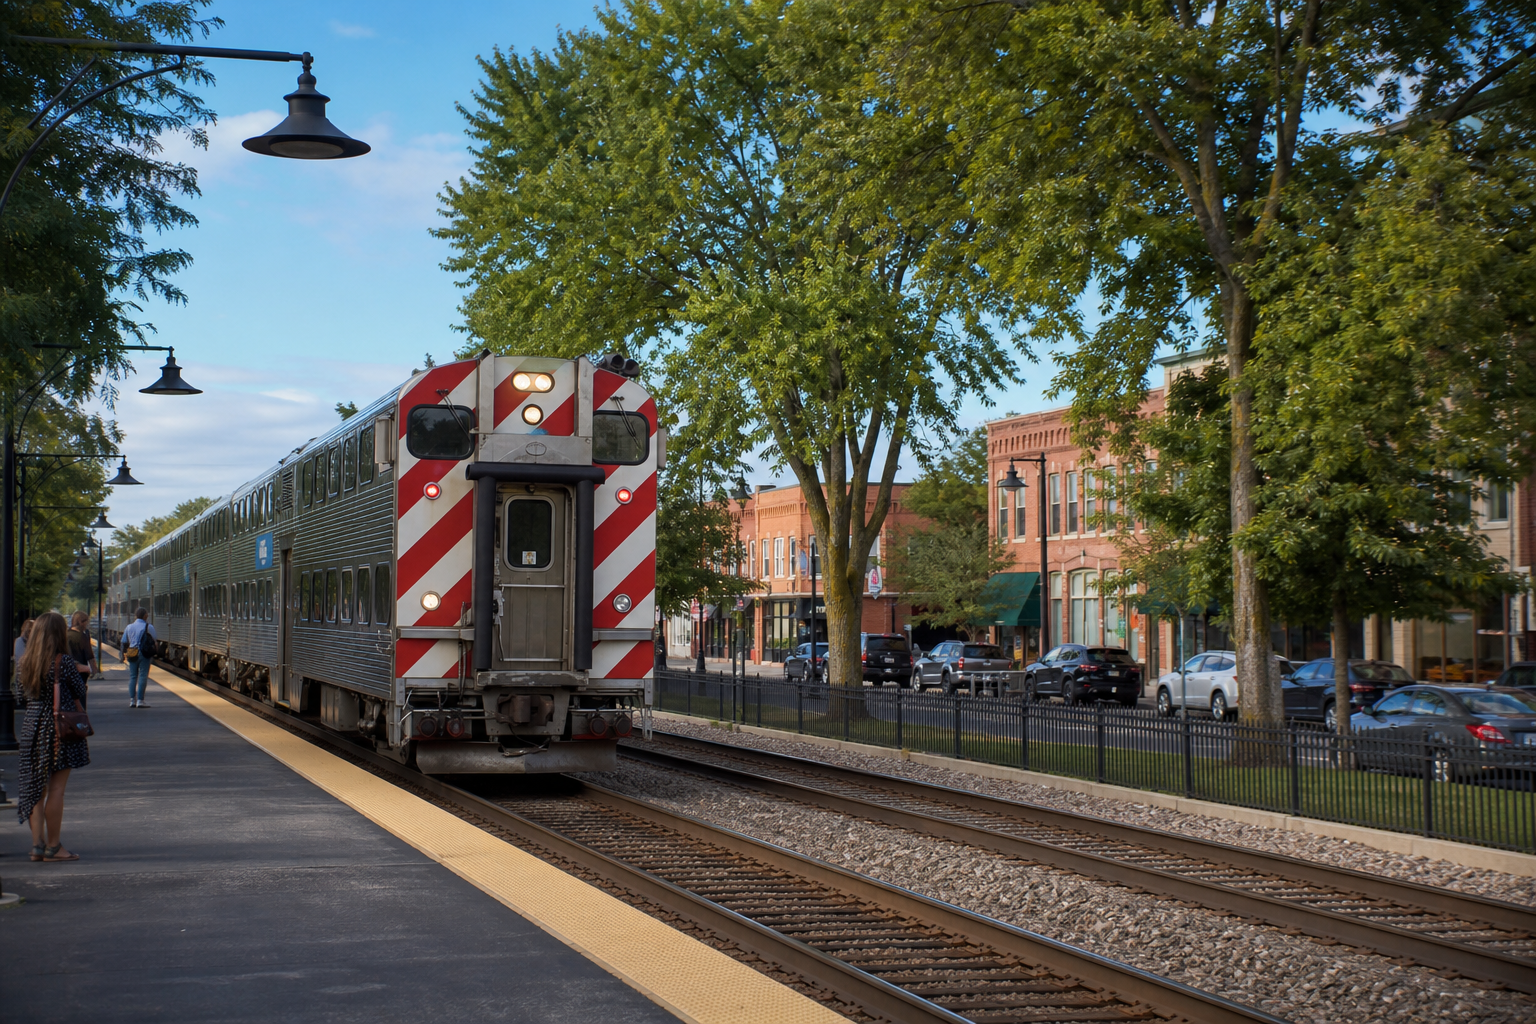

“West suburbs” is a phrase Chicagoans use constantly and define loosely. This list is organized by the factor that shapes a west-suburban commute more than anything else: which train gets you downtown. It includes the population, home-value, and income figures that start most budget conversations. It covers fifty suburbs using the latest Census estimates, with no adjectives.
How we defined the west suburbs
There’s no official boundary, so we followed the railroads. Chicago’s three westbound Metra lines, BNSF, Union Pacific West, and Milwaukee District West, leave the city heading west and fan out across Cook, DuPage, and Kane counties. We list the suburban stops on each line, plus notable communities in the same corridor that have no station. The MD-W arcs northwest as it runs toward Elgin, so a few of its towns sit north of due west. The Union Pacific Northwest line (Arlington Heights, Palatine, Barrington) is a separate corridor with its own list here.
Every population, home value, and income figure below comes from the U.S. Census Bureau’s American Community Survey (2020–2024 five-year estimates, the most recent release), and every rail assignment was checked against Metra’s own published station lists in July 2026. Where a village has more than one station, it appears once. One quirk is worth noting: the Census tops out its household-income measure at $250,000, so a figure of $250,001 in the tables below means “$250,000 or more,” not a precise median.
West suburbs grouped by Metra line
Suburbs on the BNSF Line
The BNSF runs from Union Station to Aurora. The table includes 13 suburbs.
| Suburb | Population | Median home value | Median household income |
|---|---|---|---|
| Aurora | 179,898 | $274,800 | $93,633 |
| Naperville | 150,692 | $540,200 | $155,105 |
| Cicero | 82,797 | $249,400 | $70,842 |
| Berwyn | 55,595 | $299,800 | $78,408 |
| Downers Grove | 50,054 | $449,800 | $115,114 |
| Westmont | 23,724 | $379,100 | $88,090 |
| Lisle | 23,407 | $406,800 | $107,479 |
| Brookfield | 19,331 | $332,400 | $110,295 |
| Hinsdale | 17,175 | $1,053,700 | $250,001 |
| La Grange | 15,998 | $594,300 | $159,929 |
| Western Springs | 13,446 | $739,400 | $230,255 |
| Riverside | 9,039 | $491,400 | $153,686 |
| Clarendon Hills | 8,659 | $605,800 | $130,388 |
Suburbs on the Union Pacific West Line
The Union Pacific West runs from Ogilvie Transportation Center to Elburn. The table includes 15 suburbs.
| Suburb | Population | Median home value | Median household income |
|---|---|---|---|
| Wheaton | 53,557 | $455,700 | $120,008 |
| Oak Park | 53,292 | $465,500 | $110,820 |
| Elmhurst | 45,671 | $545,400 | $149,644 |
| Lombard | 43,619 | $335,700 | $100,362 |
| Glen Ellyn | 28,390 | $544,000 | $140,938 |
| West Chicago | 25,395 | $336,800 | $99,927 |
| Melrose Park | 24,549 | $275,800 | $66,189 |
| Maywood | 23,201 | $229,800 | $68,815 |
| Villa Park | 22,345 | $329,000 | $95,015 |
| Geneva | 21,258 | $441,400 | $144,341 |
| Bellwood | 18,256 | $230,000 | $79,513 |
| River Forest | 11,992 | $687,300 | $146,786 |
| Winfield | 10,095 | $386,300 | $135,795 |
| Elburn | 6,354 | $389,300 | $127,731 |
| Berkeley | 5,199 | $246,900 | $85,823 |
Suburbs on the Milwaukee District West Line
The Milwaukee District West runs from Union Station to Elgin. The table includes 10 suburbs.
| Suburb | Population | Median home value | Median household income |
|---|---|---|---|
| Elgin | 114,934 | $273,000 | $90,282 |
| Bartlett | 40,501 | $375,700 | $133,240 |
| Hanover Park | 36,732 | $274,200 | $91,763 |
| Elmwood Park | 23,868 | $339,300 | $91,955 |
| Roselle | 22,752 | $344,700 | $111,318 |
| Bensenville | 18,603 | $272,000 | $79,515 |
| Franklin Park | 18,197 | $287,000 | $76,519 |
| Wood Dale | 13,933 | $318,900 | $91,382 |
| River Grove | 10,451 | $241,800 | $69,858 |
| Itasca | 9,355 | $390,800 | $114,294 |
West-suburban corridor communities without their own Metra station
These communities are in the corridor but do not have a station of their own. The table includes 12 suburbs.
| Suburb | Population | Median home value | Median household income |
|---|---|---|---|
| Bolingbrook | 74,096 | $314,700 | $108,400 |
| Carol Stream | 39,460 | $335,000 | $102,309 |
| Addison | 35,489 | $341,300 | $90,431 |
| Woodridge | 33,941 | $363,700 | $101,000 |
| Glendale Heights | 32,808 | $261,700 | $86,545 |
| Batavia | 27,151 | $387,400 | $120,056 |
| Darien | 21,879 | $398,700 | $111,215 |
| North Aurora | 18,696 | $342,100 | $114,305 |
| Warrenville | 14,718 | $286,100 | $100,321 |
| Burr Ridge | 11,141 | $700,400 | $156,829 |
| Willowbrook | 9,131 | $358,600 | $99,239 |
| Oak Brook | 8,056 | $903,200 | $175,870 |
What the population, home-value, and income figures show
The spread is enormous. Median home values across these 50 suburbs run from about $230,000 in Maywood to just over $1 million in Hinsdale. That is a factor of more than four within one metro area, sometimes among towns only a few train stops apart. “The west suburbs” is not a price point.
One line can span the whole range. On the BNSF, Hinsdale ($1,053,700) and Western Springs ($739,400) are among the priciest addresses in the region. Cicero and Berwyn are among the most affordable close-in options on any western line. Aurora and Naperville, a few stops apart at the western end, differ by roughly $250,000 in median home value. The same railroad serves very different housing markets.
Rail access does not tell the whole story. It’s tempting to read a station as a price premium, but the tables don’t support such a tidy rule. Oak Brook has no Metra stop of its own and the second-highest median home value on this list ($903,200), while several rail-served villages sit near the bottom. Schools, lot sizes, tax rates, and housing stock also differ across these towns. Use the train as a filter for your own commute, not as a proxy for value.
How to use these figures when comparing suburbs
Census five-year figures are estimates built from survey responses pooled over 2020–2024 and published for the whole municipality. They describe a town, not a house; they carry margins of error, and they lag the current market. Median home value reflects what owners say their homes are worth, which is not the same as today’s asking prices. Use these figures to narrow fifty suburbs to five, then use current listings and a walk around the block to pick one.
Remember the costs that don’t show up in a price. Illinois home-insurance premiums rose 32% between 2018 and 2022 (Federal Reserve Bank of Chicago; our breakdown here), and property tax bills vary widely across these county lines. Two houses at the same price can carry very different monthly costs.
Sources and data for this list
- U.S. Census Bureau, American Community Survey: 2024 five-year estimates, the current release (B01003 population, B25077 median home value, B19013 median household income), retrieved via the Census API on July 16, 2026.
- Metra BNSF, Union Pacific West, and Milwaukee District West station lists, verified July 16, 2026.
Compiled by KCM Desk; figures verified against the sources above as of July 16, 2026. Census estimates carry margins of error and are updated annually. Spot an error, or a suburb we should add? Corrections come first. Human-guided and edited — about this desk.
Related Keep Chicagoland Moving articles
- Chicago Transit, by the Numbers
- Suburban Cook County Recorded 22,092 Births in 2023, 20.7 Percent Fewer Than in 2015 — and Its Fertility Rate Fell in All Four Districts
- The Northwest Suburbs of Chicago: 23 Towns Along the UP-NW Corridor
- New York Just Expanded Half-Price Transit. Chicagoland Has Its Own Version — and It Runs Through December 31.
- America Is Short 4.7 Million Homes. Chicago Isn’t on the Worst-Off Lists.
- Frequently Asked Questions About Moving to Chicago