
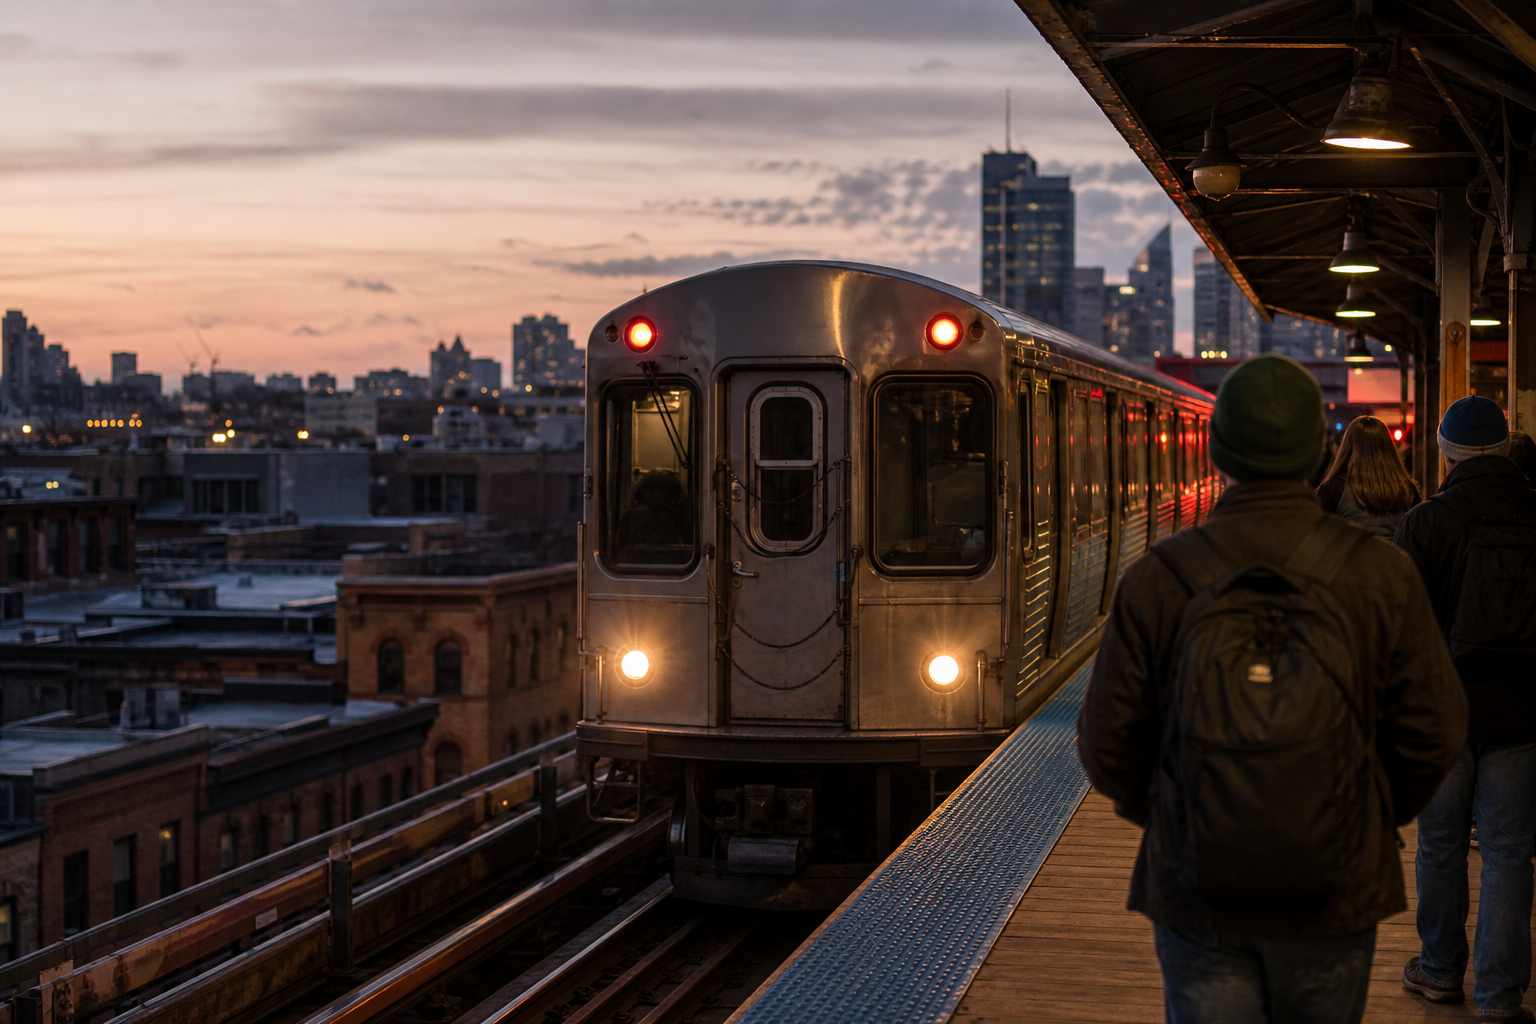

The Red Line is Chicago’s spine. It runs from the Evanston border to 95th Street on the far South Side, carries more riders than any other line, and, with the Blue Line, keeps running all night. It is also the only piece of infrastructure that touches almost every Chicago story we have computed this year: the pandemic collapse and the uneven recovery, the office towers that emptied, the one neighborhood that came back stronger, the South Side’s long population slide and its recent turn, and a multi-billion-dollar bet on what comes next.
So we built the whole ride. Below, the line unrolls from north to south. As you scroll, the panel keeps pace: the dot moves down the line, and every station shows its own quarter-century of turnstile counts, drawn from the CTA’s daily records. Big stations get their stories told in full. The quieter stops ride past as a strip, each with its own small trend line and current weekday count. All 33 stations are here.
Howard is the Red Line’s northern anchor, the border station where Chicago hands off to Evanston and where the Purple and Yellow Lines end their runs. Before the pandemic it moved 5,154 riders through its turnstiles on an average weekday. In 2025 that figure stood at 3,202, which is 62% of its old self. That ratio, roughly two-thirds, will follow us down the whole North Side.
From here the line runs the length of the city to 95th Street. It is the busiest line in the system, and one of the two that run around the clock. What happened to it over 25 years is the story of the city in miniature, and every ridership number in this ride comes from the CTA’s own daily turnstile counts.
These four stations are the newest thing on the line. Lawrence and Berwyn closed outright in 2021 for the $2.1 billion Red and Purple Modernization, Bryn Mawr and Argyle ran on temporary platforms, and the four finished glass-and-elevator stations opened to riders together on July 20, 2025, per Block Club’s reporting. Lawrence and Berwyn’s ridership lines go fully dark for four years and restart just months ago; Argyle and Bryn Mawr thin out through their temporary-platform years. Treat all four sparklines as a heartbeat monitor coming back online.
The rebuild is also the Red Line’s bet on its own future: a century-old railroad choosing to spend billions on the corridor where, as we will see farther south, the riders never fully came back.
Wilson was rebuilt a decade ago, ahead of its four neighbors, and its trajectory shows what a station can do after new concrete: 6,474 weekday entries in 2019, 5,017 in 2025, or 77% recovered. Uptown’s density is doing some of that work; the transfer to the Purple Line express does the rest.
Belmont is where the Brown Line joins and Lake View’s nightlife, Wrigleyville’s game days, and four tracks of traffic converge. It averaged 11,398 weekday entries in 2019 and 7,047 in 2025, which is 62% — almost exactly the system’s overall recovery. If you want one station that stands in for the whole L, this is it.
It is also where our rat analysis and this ridership analysis intersect, since Lake View leads the city in rodent complaints per square mile. Density gives with one hand and gnaws with the other.
The line dives under the city between Fullerton and this platform — North/Clybourn is the first stop of the State Street subway — and the character of its riders changes. The State Street subway stations exist mostly to deliver people to desks, and the desks have not called everyone back. Chicago station, serving River North, runs at 55% of 2019. Lake, the connection to the whole Loop elevated, has fallen from 20,912 weekday entries to 10,559. Monroe sits at 41%.
This stretch is the deepest wound on the line, and the pattern is consistent with hybrid work keeping commuters home. Our business-license analysis found the Loop losing more new licensed businesses than any other major commercial area over the same years. The subway did not fail downtown. Downtown changed underneath it.
Roosevelt, serving the South Loop’s museums and a decade of new towers, holds 66% of its 2019 riders — noticeably healthier than the subway core a few stops north. From here south, the line’s story splits in two.
Here is the ride’s one unqualified success. Cermak-Chinatown averaged 3,969 weekday entries in early 2019 and 4,126 in 2025 — 104% of its pre-pandemic self, the only Red Line station above its 2019 level and one of just two in the entire system. The neighborhood runs on a seven-day rhythm of restaurants, groceries, and family visits rather than an office calendar. The turnstiles record the result; the reasons belong to the people walking through them.
Its 2025 average is also higher than anything in its own recorded history before 2015. Whatever the rest of the map is recovering toward, this corner already arrived.
South of Sox-35th the line runs down the middle of the Dan Ryan Expressway, and the numbers tell a story that started long before 2020. Garfield averaged 2,871 weekday entries in 2019 against 4,487 at its 2001 peak; 63rd, 69th, 79th, and 87th all follow the same shape. These stations have lost riders across two decades in step with long-running population decline in the surrounding areas. The freshest related signal is county-level, not neighborhood-level, and it points the other way: Census estimates show Cook County growing again since 2023.
It is worth saying plainly: fewer riders is not a verdict on the people riding. It is arithmetic about how many people live nearby, and for the first time in years, that arithmetic is improving.
The southern terminal is the busiest bus-rail hub on the South Side, rebuilt in 2019, moving 5,577 weekday riders in 2025 against 8,950 in 2019 and 14,239 at its 2001 peak. Every one of those numbers is an argument in the biggest transit bet on the city’s table: the 5.5-mile Red Line extension now under construction toward 130th Street, which wagers billions that the far South Side’s next 25 years look different from its last 25.
That is where this ride ends: at a terminal that is about to stop being one.
What the whole ride adds up to
Read end to end, the Red Line is three different railroads sharing one track. The North Side above the river is a dense, mostly recovered commuter and neighborhood line running near two-thirds of its old volume, with four brand-new stations betting on more. The downtown subway is an office delivery system still waiting for the offices, running near half. And the Dan Ryan stretch is a decades-long population story that predates the pandemic entirely, where the most important number is not on this page: it is the county-level Census estimate showing Cook County growing again since 2023, and the extension crawling toward 130th Street to meet it.
One station refuses all three descriptions. Cermak-Chinatown, alone on the line, carries more riders today than it did before the pandemic. If the city wants to study a neighborhood whose transit use does not rise and fall with office schedules, there is one on the Red Line, and its turnstiles are open for inspection.
Where these numbers come from
Every figure is an average of weekday entries recorded by the CTA’s turnstiles, computed by year for each station from the city’s public daily dataset, 2001 through May 2026. Entries are not full ridership: transfers inside the system are not counted. Gaps in a station’s line mean closure, not absence of riders; Lawrence and Berwyn sat closed from 2021 until July 2025 for the Red and Purple Modernization, and their histories restart there. The 2026 points cover January through May only. Station positions come from the CTA’s published coordinates. The full method, citywide context, and every other line’s numbers live in our 25-year analysis and the station lookup tool.
Computed by KCM Desk as of July 18, 2026. We’ll extend the ride when full-year 2026 data lands in January 2027. Spot an error? Corrections come first. Human-guided and edited — about this desk.