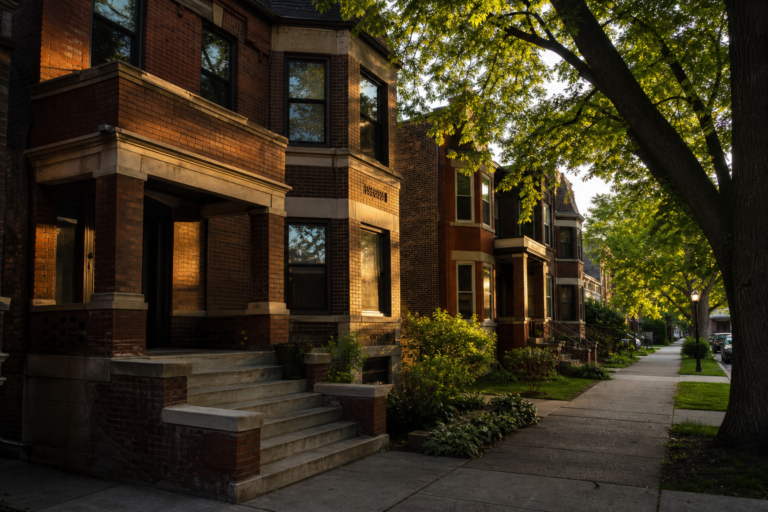
Category Moving Here

Guides for anyone relocating to Chicago or its suburbs: what homes cost, how buying works here, and the practical questions every move raises. Researched from local data and sources, and updated as the answers change.

Chicago’s Condo Deconversion Pattern: 69 Buildings Bought in Bulk Since 2018 Left the Tax Rolls as Condominiums, the Nearest Parcels Now Classed as Apartment Buildings or Two-to-Six-Flats

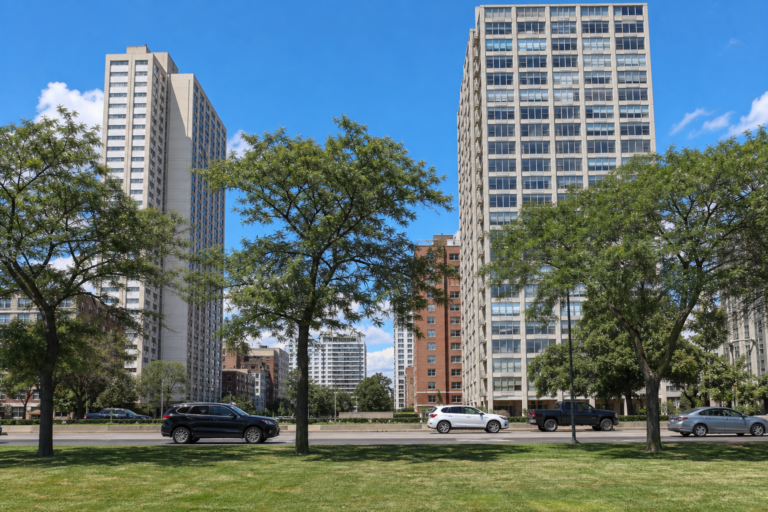
Mid-century high-rise residential towers along a tree-lined lakefront drive on Chicago's North Side

Sixty-nine Chicago condominium buildings bought in bulk since 2018 have left the tax rolls as condominiums, the nearest parcels now classed as apartment buildings or two-to-six-flats; 46 were bought in 2018 through 2020. Chicago requires 85 percent of unit owners to approve such a sale.

Half of Cook County’s Houses and Small Apartment Buildings Date From 1954 or Earlier — and 2.2 Percent From 2010 or Later, by the Assessor’s Count

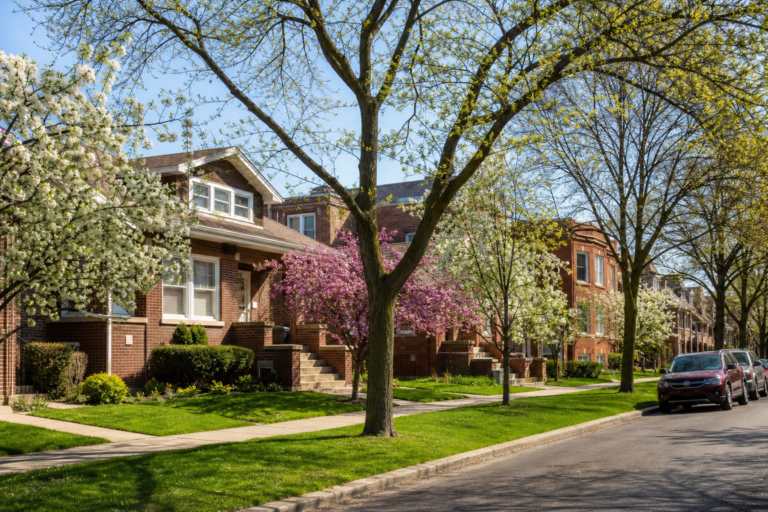
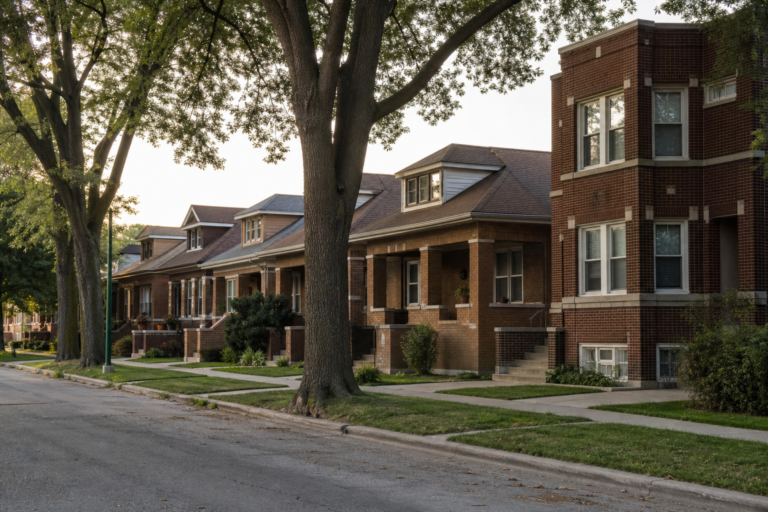
A tree-lined residential street of brick bungalows and a two-flat in late-afternoon light

The Cook County Assessor’s building file, tax year 2025: just over half of the county’s 1.1 million houses and small apartment buildings date from 1954 or earlier, and 2.2 percent from 2010 or later. The middle year is 1925 in Chicago’s townships and 1960 in the suburban ones, and the count has barely grown since 2008.

Lincoln Park Holds 1,590 of the 9,282 Properties Chicago’s Historic Survey Rated Red or Orange — About One in Six, While Four Community Areas Have None

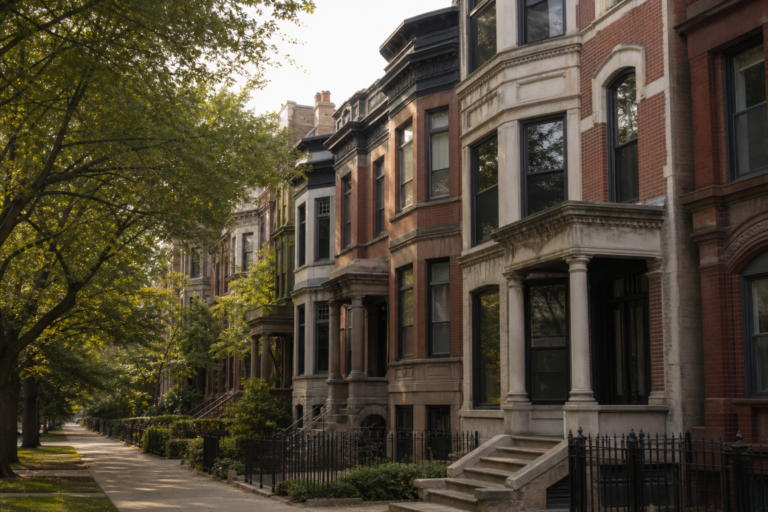
A row of late-1800s brick and greystone rowhouses with ornate cornices on a quiet street

The Chicago Historic Resources Survey file behind the city’s Demolition-Delay Ordinance, read whole and placed by community area: 9,282 properties rated red or orange, 1,590 of them in Lincoln Park and none in Burnside, Calumet Heights, Mount Greenwood or Riverdale. The Loop and Near North Side hold 80 of the 151 placed red-rated properties, 63.7 percent of dated rows were built before 1900, and the file’s demolished flag marks just four.

12 Numbers for Anyone Moving to Chicago, From Public Agencies’ Own Records

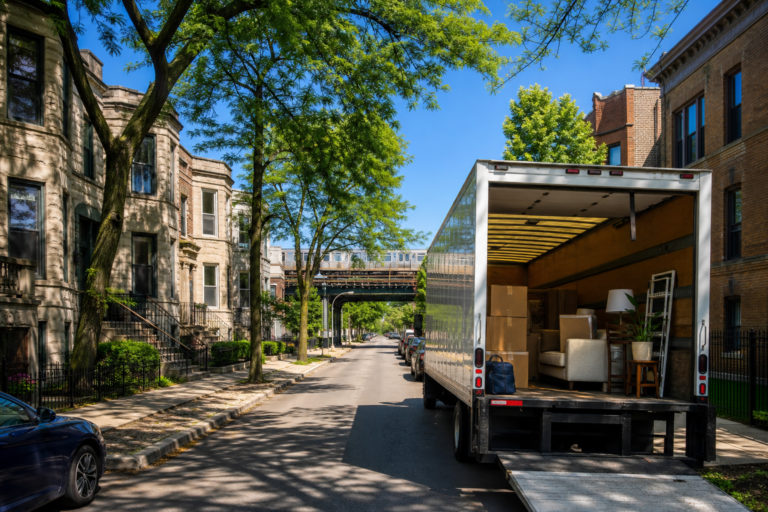
Moving truck on a Chicago block of greystones and two-flats with an L viaduct at the end of the street

Twelve numbers for anyone weighing a move to Chicago, each from a public agency's own file and a published KCM analysis: the 81 percent valuation-to-sale ratio, 60 percent of self-filed appeals winning, an October 1 tax due date, 311's clocks, 69,852 basement-flooding requests, 2.76 million potholes filled, 3,852 house-share registrations, 86/65 percent transit recovery, $4.21-a-mile rideshares, a $1,750 federal rent figure, and 5 percent of beach tests at advisory level.

The Chicago Community Areas With the Most Registered Murals

Several colorful abstract murals painted along a brick alley wall

West Town has more registered murals than any other Chicago community area - 66 of the 458 on the city's own Mural Registry - with Uptown at 56 and the Loop at 54 behind it. The top ten areas, each count placed by the mural's own coordinates, and the registry-not-a-census rule that scopes every rank.

Chicago’s Mural Registry Lists 458 Works — and West Town, Uptown, and the Loop Hold 176 of Them

Colorful abstract mural on a brick wall in afternoon light

Chicago's own Mural Registry lists 458 works, and three community areas - West Town, Uptown, and the Loop - hold 176 of them. Install years run 1971 to 2024 with the busiest years in 2017 and 2019, 55 of 77 areas hold at least one, and the registry's own area column disagrees with its own coordinates on nearly half its rows - so every mural here is placed by its coordinates. The registry as recorded, mapped in full.

Moving HereLiving HereCity in MotionNeighborhoods & Suburbs
About · Editorial Policy · Our Data & Methods · Privacy · Terms · Contact
© 2026 Keep Chicagoland Moving · A TAK Marketing, LLC publication · Part of the fabulous Omnishun information systems