
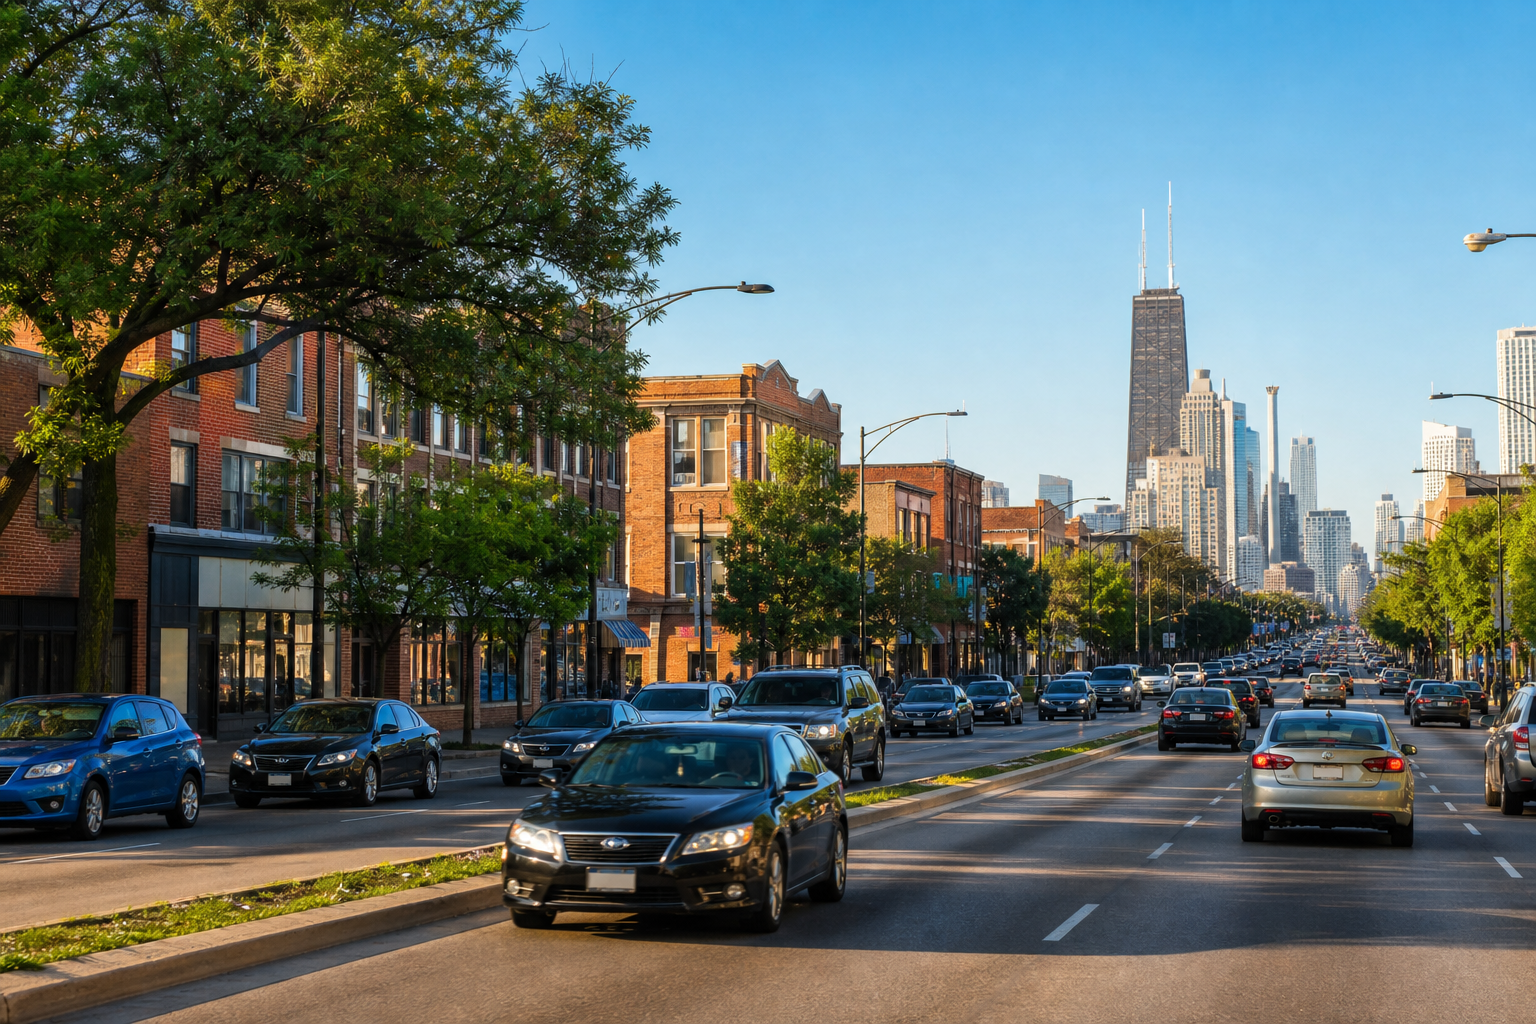

The busiest measured street segment in Chicago is Ontario Street westbound, N La Salle Dr to N Orleans St, averaging 33,466 vehicles a day across its June 1–July 31, 2026 daily readings from the city’s own traffic counter. Across the 2,280 street segments that counter measured this summer, four of the ten busiest sit on Cicero Avenue between 45th and 50th Streets. By the city dataset’s own description, the counts are a by-product of the traffic and speed enforcement cameras Chicago already operates — their vehicle counts are published daily as the Average Daily Traffic feed, each figure a trailing 30-day average — and our full analysis of that feed explains the method, the limits, and what the rest of the network shows. Here are the ten busiest measured stretches, in order.
1. Ontario Street westbound, N La Salle Dr to N Orleans St
Ontario Street westbound between N La Salle Dr and N Orleans St averaged 33,466 vehicles a day across its June–July 2026 daily readings, the No. 1 measured segment in Chicago. Three of the ten sit within a few blocks of each other here: this stretch, the Ohio Street segment at No. 9, and the Orleans Street segment at No. 10.
2. Cicero Avenue northbound, W 47th St to W 45th St
Cicero Avenue northbound between W 47th St and W 45th St averaged 32,450 vehicles a day across its June–July 2026 daily readings, the No. 2 measured segment in Chicago. It is one of four segments of Cicero Avenue between 45th and 50th Streets in this top ten, the most of any street on the list.
3. Cicero Avenue southbound, W 45th St to W 47th St
Cicero Avenue southbound between W 45th St and W 47th St averaged 31,908 vehicles a day across its June–July 2026 daily readings, the No. 3 measured segment in Chicago. It is one of four segments of Cicero Avenue between 45th and 50th Streets in this top ten, the most of any street on the list.
4. Cicero Avenue southbound, W 47th St to W 50th St
Cicero Avenue southbound between W 47th St and W 50th St averaged 29,757 vehicles a day across its June–July 2026 daily readings, the No. 4 measured segment in Chicago. It is one of four segments of Cicero Avenue between 45th and 50th Streets in this top ten, the most of any street on the list.
5. Cicero Avenue northbound, W 50th St to W 47th St
Cicero Avenue northbound between W 50th St and W 47th St averaged 29,274 vehicles a day across its June–July 2026 daily readings, the No. 5 measured segment in Chicago. It is one of four segments of Cicero Avenue between 45th and 50th Streets in this top ten, the most of any street on the list.
6. Stony Island Avenue southbound, E 95th St to S Bishop Ford Expy Er
Stony Island Avenue southbound between E 95th St and S Bishop Ford Expy Er averaged 27,578 vehicles a day across its June–July 2026 daily readings, the No. 6 measured segment in Chicago. The city file’s endpoint labels for this stretch name 95th Street and the Bishop Ford.
7. Stony Island Avenue northbound, S Bishop Ford Stony Island Av Xr to E 95th St
Stony Island Avenue northbound between S Bishop Ford Stony Island Av Xr and E 95th St averaged 26,127 vehicles a day across its June–July 2026 daily readings, the No. 7 measured segment in Chicago. The city file’s endpoint labels for this stretch name 95th Street and the Bishop Ford.
8. 99th Street eastbound, S Halsted St to S Wallace St
99th Street eastbound between S Halsted St and S Wallace St averaged 25,709 vehicles a day across its June–July 2026 daily readings, the No. 8 measured segment in Chicago. It is the only segment in the top ten on a numbered street.
9. Ohio Street eastbound, N La Salle Dr to N Dearborn St
Ohio Street eastbound between N La Salle Dr and N Dearborn St averaged 23,589 vehicles a day across its June–July 2026 daily readings, the No. 9 measured segment in Chicago. It sits within the same few blocks as the Ontario segment at the top of this list.
10. Orleans Street northbound, W Ohio St to W Kennedy Ontario St Er
Orleans Street northbound between W Ohio St and W Kennedy Ontario St Er averaged 23,001 vehicles a day across its June–July 2026 daily readings, the No. 10 measured segment in Chicago. It sits within the same few blocks as the Ontario segment at the top of this list.
Questions these numbers can answer
What is the busiest street in Chicago? By the city’s camera-derived counter, the single busiest measured segment is Ontario Street westbound, N La Salle Dr to N Orleans St at 33,466 vehicles a day (the average of its June 1–July 31, 2026 daily readings); the street most represented in the ranking is Cicero Avenue, which holds four of the ten busiest segments.
How many cars a day use Cicero Avenue between 45th and 50th Streets? The four segments of Cicero Avenue in this top ten — both directions between 45th and 50th Streets — each averaged roughly 29,000 to 32,500 vehicles a day across their June–July 2026 daily readings.
How is this measured? By the dataset’s own documentation, Chicago’s 800-plus traffic and speed enforcement cameras count passing vehicles as a by-product of their main work; the city publishes each segment’s count daily as a trailing 30-day average. These are camera-derived estimates on the segments the network covers — not every street in the city — and streets without a camera do not appear. Expressways are not part of this surface-street feed.
Where these numbers come from
City of Chicago Average Daily Traffic Counts (gc7y-n4xa), pulled August 3, 2026: the average of each segment’s daily readings across June 1–July 31, 2026, over the 2,280 segments with readings in that window. Each daily reading is itself a trailing 30-day average, and the portal notes counts can be inaccurate under unexpected device or field conditions. Segment endpoints are printed as the city’s file records them, abbreviations included. The ranking, the matched-segment trend, and every caveat in full: The Traffic Census Inside Chicago’s Enforcement Cameras.
Computed by KCM Desk from records current to August 3, 2026. Human-guided and edited — about this desk. If you spot an error, corrections come first.