
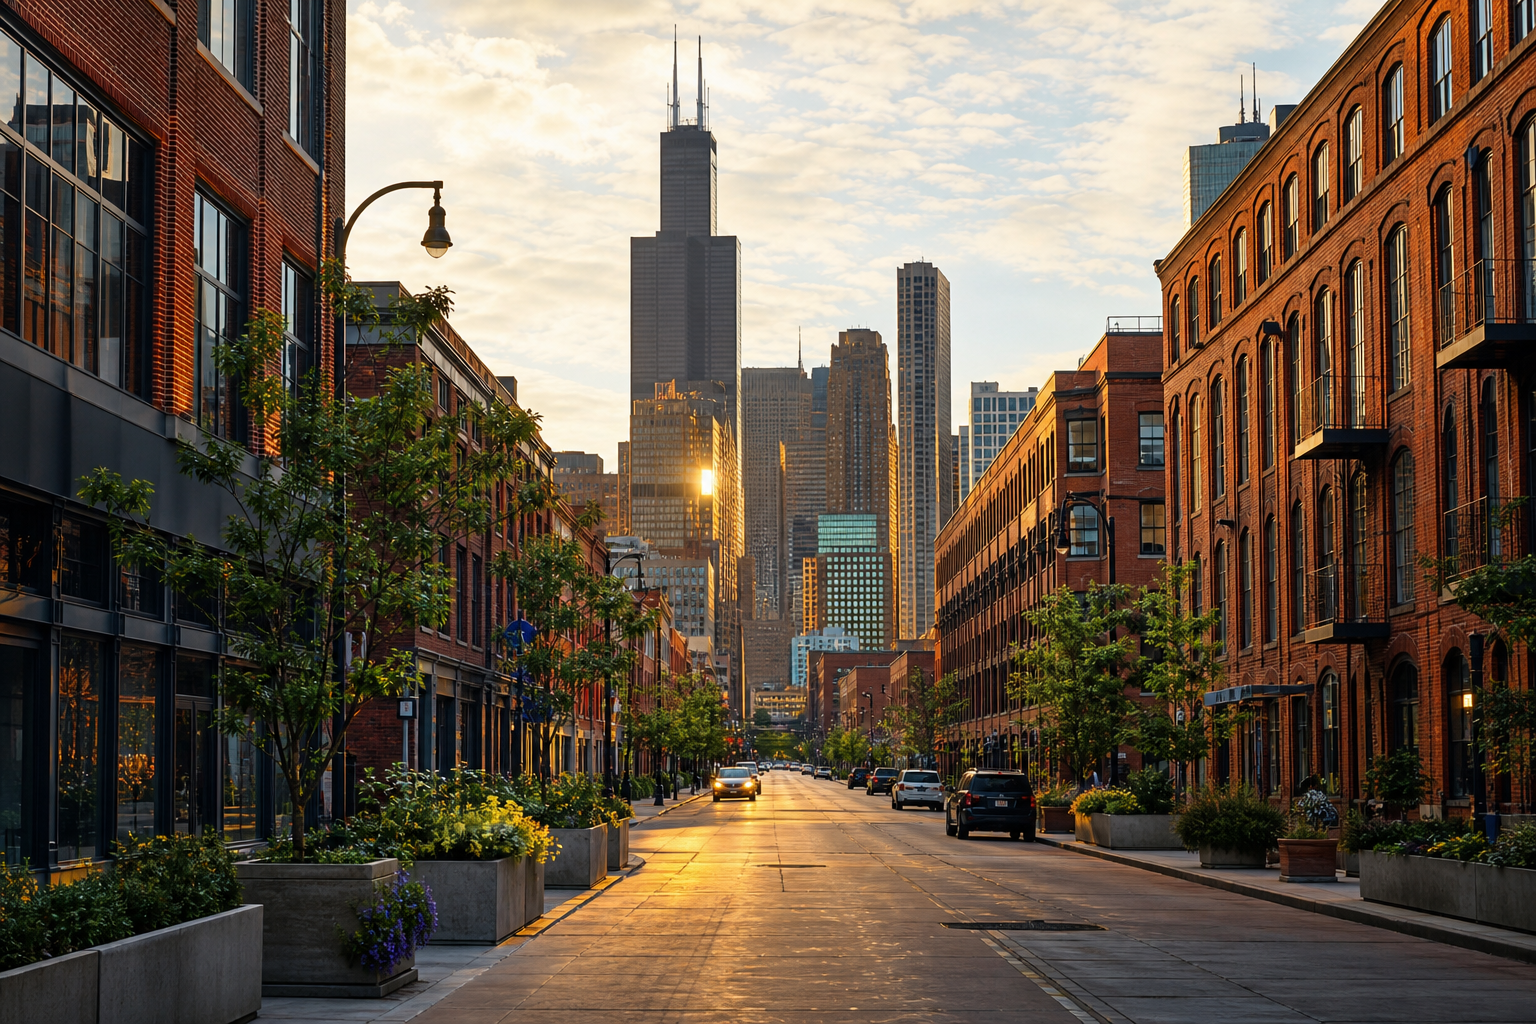

The Kinzie Industrial Corridor TIF holds more money than any other Chicago TIF district: $293.0 million at the end of the 2024 report year, per the districts’ own annual reports as published on the city’s data portal. LaSalle Central follows at $247.4 million and Near North at $169.2 million, and the ten districts below together held $1.37 billion — 45 percent of the $3.05 billion the 121 districts’ 2024 reports show in total. A balance here is exactly what the district’s own annual report states as its special fund’s end-of-year balance — an accounting figure, which this page does not characterize further. What the money is for, and what past spending bought, is not something the report datasets record — the full analysis explains that boundary and every counting rule. These are the reports’ own figures, and this page takes no position on any district’s merits or where anyone should live or invest.
1. Kinzie Industrial Corridor — $293.0 million
The Kinzie Industrial Corridor district reported a $293.0 million special-fund balance at the end of the 2024 report year. Its reports also show $171.5 million in increment collected that year and $904.3 million collected over the district’s life. All three are the reports’ own figures, rounded here from exact dollars.
2. LaSalle Central — $247.4 million
The LaSalle Central district reported a $247.4 million special-fund balance at the end of the 2024 report year. Its reports also show $211.4 million in increment collected that year and $1,206.5 million collected over the district’s life. All three are the reports’ own figures, rounded here from exact dollars.
3. Near North — $169.2 million
The Near North district reported a $169.2 million special-fund balance at the end of the 2024 report year. Its reports also show $43.9 million in increment collected that year and $520.3 million collected over the district’s life. All three are the reports’ own figures, rounded here from exact dollars.
4. Canal/Congress — $113.7 million
The Canal/Congress district reported a $113.7 million special-fund balance at the end of the 2024 report year. Its reports also show $72.7 million in increment collected that year and $600.1 million collected over the district’s life. All three are the reports’ own figures, rounded here from exact dollars.
5. Pilsen Industrial Corridor — $105.3 million
The Pilsen Industrial Corridor district reported a $105.3 million special-fund balance at the end of the 2024 report year. Its reports also show $39.7 million in increment collected that year and $338.8 million collected over the district’s life. All three are the reports’ own figures, rounded here from exact dollars.
6. Central West — $105.0 million
The Central West district reported a $105.0 million special-fund balance at the end of the 2024 report year. Its reports also show $48.9 million in increment collected that year and $440.2 million collected over the district’s life. All three are the reports’ own figures, rounded here from exact dollars.
7. River West — $103.4 million
The River West district reported a $103.4 million special-fund balance at the end of the 2024 report year. Its reports also show $42.6 million in increment collected that year and $388.3 million collected over the district’s life. All three are the reports’ own figures, rounded here from exact dollars.
8. Midwest — $89.5 million
The Midwest district reported a $89.5 million special-fund balance at the end of the 2024 report year. Its reports also show $21.8 million in increment collected that year and $305.1 million collected over the district’s life. All three are the reports’ own figures, rounded here from exact dollars.
9. Cortland/Chicago River — $79.9 million
The Cortland/Chicago River district reported a $79.9 million special-fund balance at the end of the 2024 report year. Its reports also show $5.5 million in increment collected that year and $24.5 million collected over the district’s life. All three are the reports’ own figures, rounded here from exact dollars.
10. 47th/King Drive — $68.0 million
The 47th/King Drive district reported a $68.0 million special-fund balance at the end of the 2024 report year. Its reports also show $13.2 million in increment collected that year and $162.5 million collected over the district’s life. All three are the reports’ own figures, rounded here from exact dollars.
Questions these numbers can answer
Which Chicago TIF district has the most money? The Kinzie Industrial Corridor, whose annual report shows a $293.0 million special-fund balance at the end of the 2024 report year — ahead of LaSalle Central at $247.4 million.
How much money is in Chicago’s TIF funds altogether? $3.05 billion across the 121 districts that filed 2024 annual reports — more than double the $1.42 billion the 2017 reports showed, in a roster that shrank from 144 districts. No district reported a negative balance.
What is a TIF fund balance? When a TIF district is created, its assessed value is frozen as a base; the tax revenue generated by growth in assessed value above that base flows into the district’s special fund. The balance is the end-of-year figure the district’s own annual report states for that fund.
Where these numbers come from
The City of Chicago’s TIF annual-report special-fund dataset (qm7s-3ctt), report years 2017–2024, retrieved August 13, 2026: one row per district per report year, with balances, increment, and cumulative collections as the districts reported them. Sums and rankings are ours; every dollar figure is the reports’. The full arc — balances doubling since 2017 in a shrinking roster — is in Chicago’s TIF Funds Held $3.05 Billion in the 2024 Reports — More Than Double 2017, in Fewer Districts.
Computed by KCM Desk from records retrieved August 13, 2026. Human-guided and edited — about this desk. If you spot an error, corrections come first.