
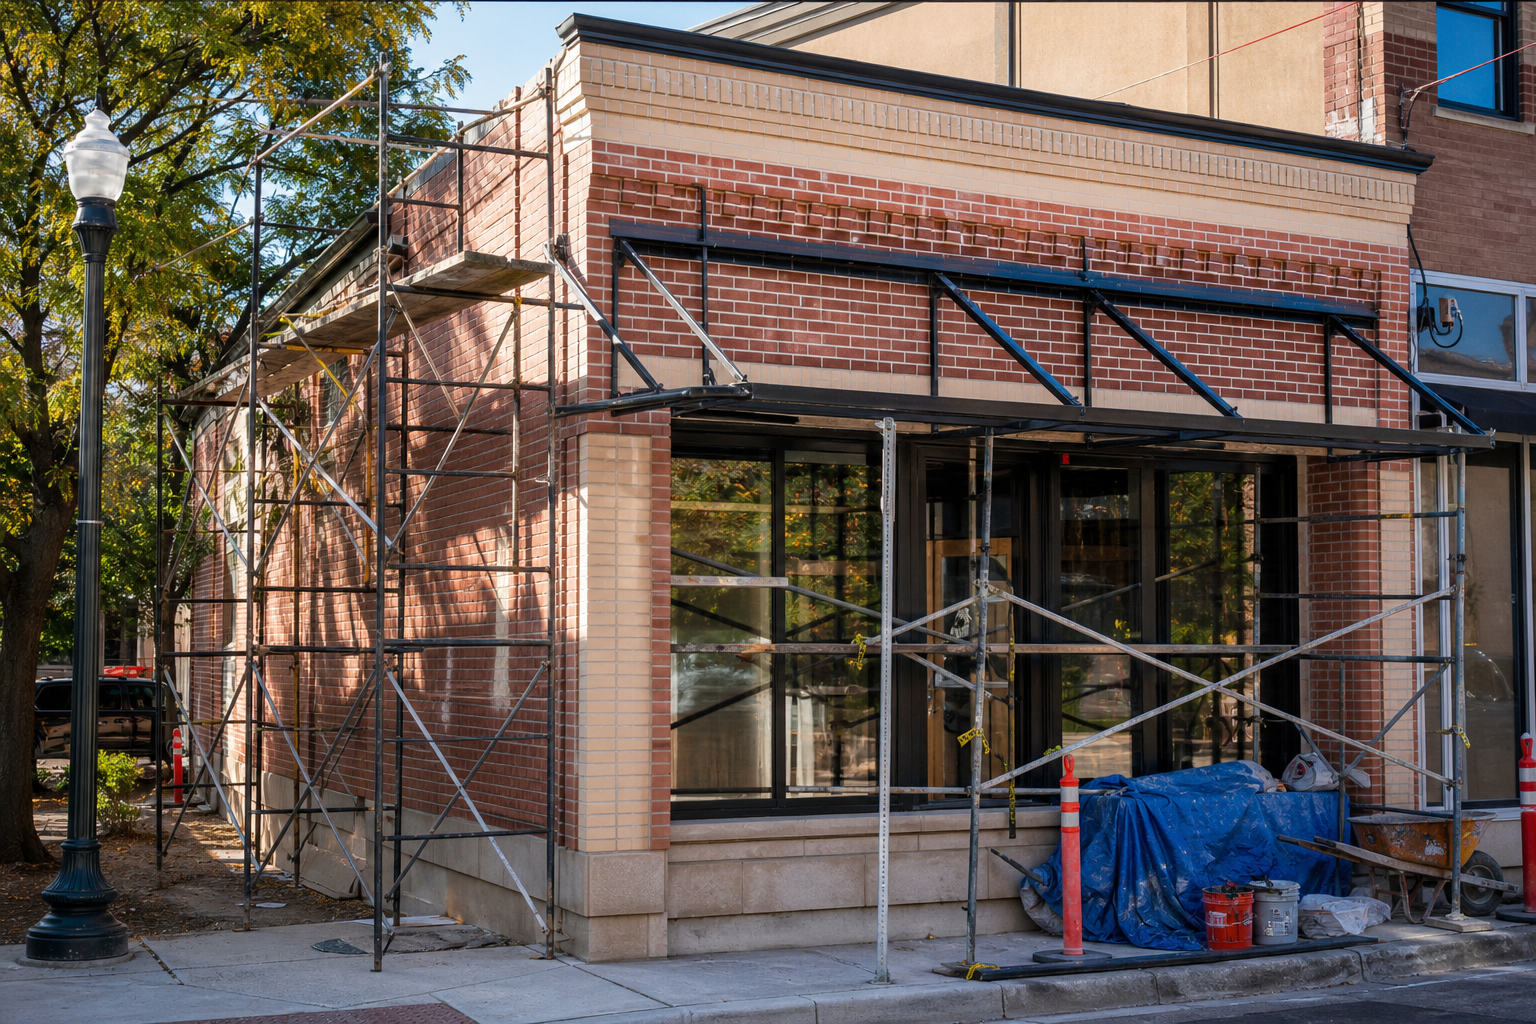

The Small Business Improvement Fund is the city’s program for fixing up commercial and industrial buildings with TIF money, and its completed-project file covers, in the portal’s words, “all projects that have received a final grant payment since January, 2001” — 2,260 projects — and describes the program plainly: “SBIF uses TIF revenues to provide reimbursement grants to small commercial and industrial businesses and property owners to help fund permanent improvements to their buildings.” Read whole, the file says: $158,290,850 in grants paid against $311,428,135 in total project costs — the fund has covered 50.8 cents of every project dollar it touched, and the median project got 60.1 percent of its cost back. The median grant is $55,331; the largest single grant in the file is $310,585 and the smallest is $330.50. The busiest year by projects was 2012 (166); the biggest by dollars is 2025 ($15.8 million). And the file’s two jobs columns are named “jobs created aspirational” and “jobs retained aspirational” — the register itself flags those numbers as hopes, and so does this page. No applicant or project name from the file appears here — its applicant column holds people’s names — so the fund is counted in dollars, counts, and place names only.
Financial Incentive Projects – Small Business Improvement Fund (etqr-sz5x), 2,260 completed-project rows since January 2001 · retrieved August 28, 2026; the whole file was downloaded and every figure recomputed, medians exact · no applicant or project name is printed · program terms and how to apply live on the city’s own SBIF pageThe fund, summed
Two ways to state the fund’s share, both computed from the file: summed across all 2,260 projects, grants covered 50.8 percent of total project costs ($158.3 million of $311.4 million); project by project, the median share was 60.1 percent, computed on the 2,258 rows carrying both a grant and a positive cost. The spread is wide — $330.50 at the bottom of the grant column, $310,585 at the top — and the middle is a $55,331 grant. What share any future applicant gets, and the program’s current caps, are the city’s to state and change over time; the city’s SBIF page, linked above, carries the terms. This page reports what the completed file actually paid.
Where the money landed
| Community area | Projects | Grant dollars |
|---|---|---|
| Near West Side | 163 | $11,045,737 |
| Portage Park | 139 | $8,308,660 |
| West Town | 119 | $7,233,199 |
| Logan Square | 90 | $5,854,881 |
| Lincoln Square | 88 | $5,850,693 |
| Humboldt Park | 87 | $7,427,332 |
The Near West Side leads with 163 projects and $11.0 million; Portage Park’s 139 projects rank second. Because SBIF spends TIF money, the file also names each project’s TIF district — 121 districts appear — and the district with the most projects and the largest grant total in the file is the Kinzie Industrial Corridor TIF: 171 projects, $11.1 million. Our TIF coverage, linked below, reads those districts’ own books. Property types, as the file prints them, keep Commercial (1,154), General Commercial (275) and Retail (74) as separate labels, with Industrial at 365.
A quarter century of completed projects
| Year (completion) | Projects | Grant dollars |
|---|---|---|
| 2001 | 7 | $231,873 |
| 2005 | 41 | $1,282,855 |
| 2010 | 116 | $6,867,691 |
| 2012 | 166 | $14,058,573 |
| 2015 | 114 | $7,396,395 |
| 2020 | 85 | $6,185,832 |
| 2023 | 123 | $9,951,539 |
| 2024 | 123 | $12,480,413 |
| 2025 | 147 | $15,824,453 |
| 2026 | 63 | $6,761,024 |
What the file calls the jobs
On 1,631 of the 2,260 rows, the file records job figures — and names its own columns “jobs created aspirational” and “jobs retained aspirational.” Summed as filed: 8,220 aspirational jobs created and 19,541 aspirational jobs retained. The file does not say whether any of those hopes came true, no follow-up column exists, and this page counts them under the label the file itself chose.
- Source: the city’s SBIF completed-projects file (etqr-sz5x): 2,260 rows, one per project with a final grant payment since January 2001, retrieved August 28, 2026. The whole file was downloaded; sums, medians, minima and maxima are exact.
- Names: the file’s applicant column holds people’s names and its project column can; neither is printed here. Every figure is a count, a dollar sum, or a place.
- Shares: the 50.8 percent figure is summed grants over summed costs; the 60.1 percent figure is the median of per-project grant-to-cost ratios on the 2,258 rows with both figures. Neither is a statement of the program’s current terms, which live on the city’s SBIF page.
- Jobs: the jobs figures are summed exactly as filed under the file’s own column names, which include the word “aspirational”; nothing on this page treats them as outcomes.
- Labels and rounding: property types and TIF district names are counted as printed; community-area labels are case-folded before grouping (the file mixes ALBANY PARK and Albany Park); completion year is the file’s completion date. Dollar totals and the median grant are rounded to the dollar in prose; the committed data file keeps the cents.
Computed by KCM Desk from the city’s SBIF completed-project records, retrieved August 28, 2026. Human-guided and edited — about this desk. If you spot an error, corrections come first.
Related Keep Chicagoland Moving coverage
- How Chicago Works, by the Numbers
- Chicago’s TIF Funds Held $3.05 Billion in the 2024 Reports — More Than Double 2017, in Fewer Districts
- Chicago Has Approved $6.46 Billion in TIF Deal Subsidies Since 1986 — and the Two Biggest Went to the CTA
- The Register Behind the Weird Lines on Your Chicago Receipt: 41,940 Tax Registrations, 35 Labels — and Two Labels With One Registrant Each