
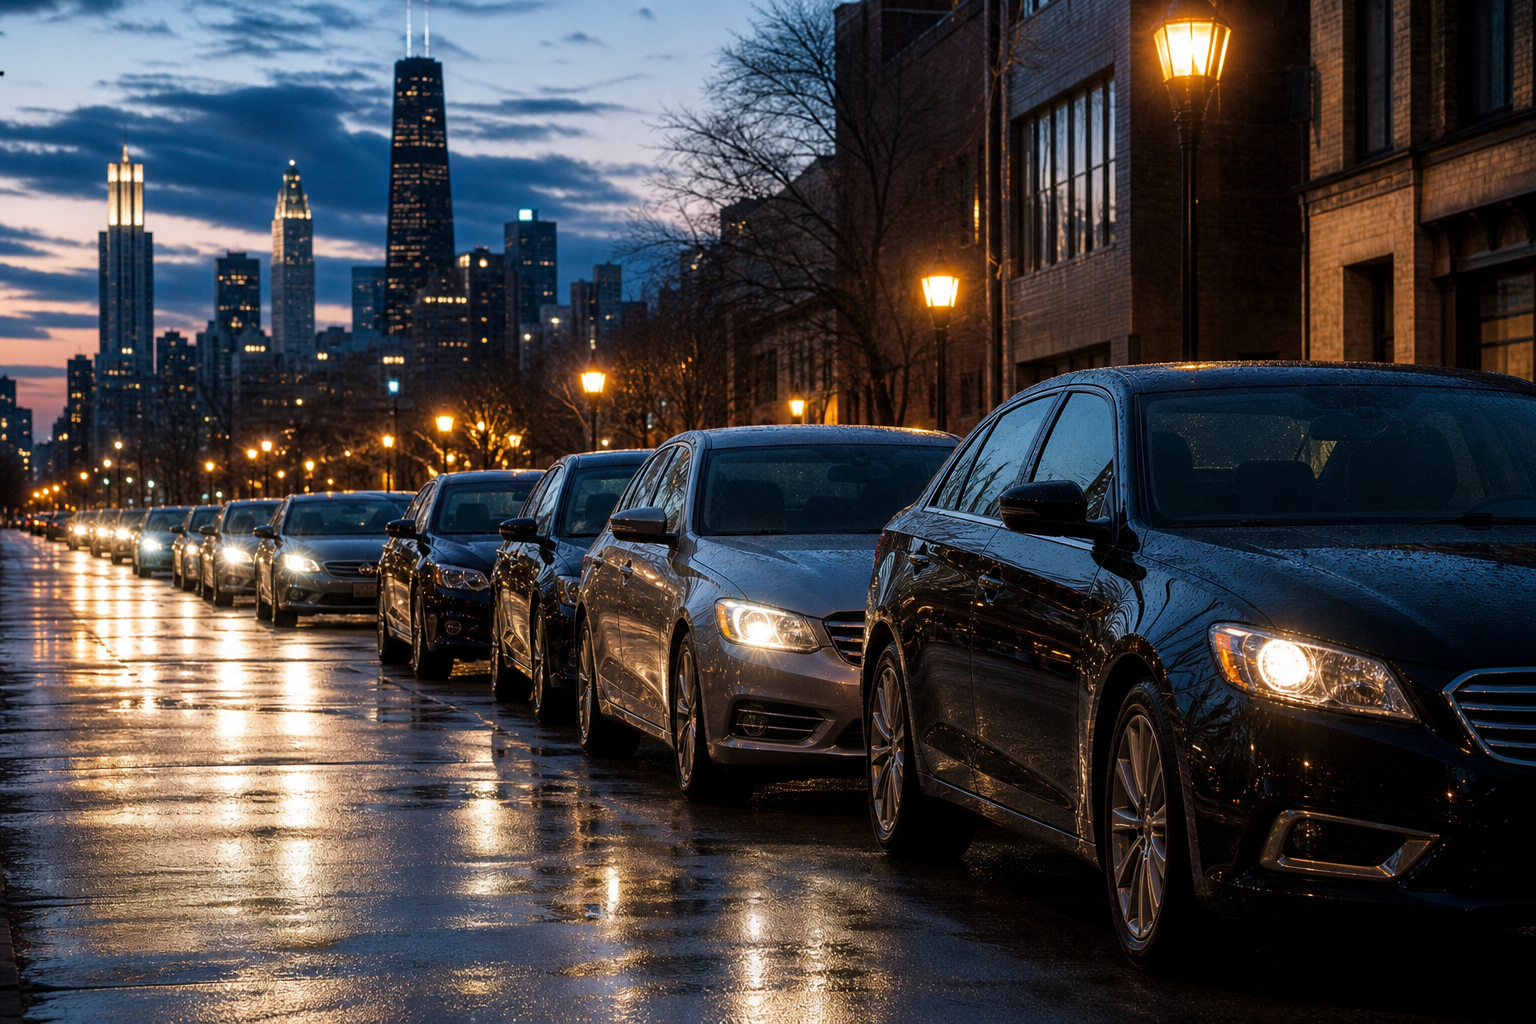

You tap the app, the little car icon swings toward you — what will it be? Chicago keeps the answer in a register. The companies report every vehicle to the city monthly under ordinance, and the June 2026 reports list 97,695 of them. One in three is a Toyota — 31,763 — and the seven most common models in the file are all Toyotas, with the Camry (4,753) at the top. The color race is a photo finish: Black 24,434, Silver 24,266 — a margin of 168 cars, less than a fifth of one percent of the fleet. And note what a row in this file means, in the portal’s own words: “the vehicle was eligible for trips in Chicago in that month for at least one day, regardless of whether it actually provided any rides.” Eligible, not busy: 33,278 of those June vehicles — a third — reported zero trips.
Transportation Network Providers — Vehicles (bc6b-sq4u), 12,862,175 vehicle-month rows, March 2015 through June 2026, retrieved August 30, 2026 · one row per vehicle per reporting month · the file has no name, plate, or VIN column — every row is a car described by make, model, color, year, state, and trip count · all figures computed server-side from the full fileOne in three is a Toyota
The June 2026 make table reads like a podium with one company on every step: Toyota 31,763, then Honda 10,150, Nissan 6,900, Chevrolet 6,686, Hyundai 6,167, Kia 5,782, Ford 5,725 — and Tesla eighth at 3,111. Forty-six make labels appear in all. Go down to model level and the top of the chart is a Toyota monologue: Camry (4,753), Camry Hybrid (3,539), Corolla (3,362), Prius (3,253), RAV4 (2,632), RAV4 Hybrid (2,191), Sienna (2,108) — seven straight before the Nissan Rogue (2,103) breaks the streak. The file lists Camry and Camry Hybrid as separate labels; sum them — our arithmetic — and the nameplate reaches 8,292, nearly one car in eleven. Why Toyota? The register logs cars, not reasons, so the why stays open here. The what is settled: no nameplate appears in the file more often.
Black wins the color race by 168 cars
Eighteen color labels appear in the June 2026 file, and the top two are separated by less than two-tenths of one percent of the fleet: Black 24,434, Silver 24,266. White follows at 18,075, then Gray (9,871), Blue (9,102), Red (6,692). Green musters 1,056. Another 1,018 rows carry no color at all — counted here, apart, as blank. If you have ever squinted at three near-identical gray sedans wondering which one is yours, this table is the arithmetic behind that squint: more than half the register is Black, Silver, or Gray.
The fleet’s calendar runs from 2009 to 2027
How old can the car be? The register’s observed floor — we state no rule, only what the file holds — is model year 2009: 108 such vehicles were still listed in the June 2026 reports, seventeen model years old. The median model year is 2020, so the typical car in the file is about six model years old. The single biggest model year is 2025, with 9,828 vehicles. And at the far edge sits a small fleet from the future: 49 vehicles in the June 2026 reports carry model year 2027 — a model year ahead of the calendar they were reported in, which is how model years work and is still a pleasure to find in a city file.
More cars than drivers, and two trip totals that don’t quite meet
Set this register beside its sibling, the drivers file we read in August: for June 2026 the companies reported 97,695 vehicles but 86,195 drivers — 11,500 more vehicle records than driver records, by the two files’ own counts. Both registers crested in the same month, March 2017: 154,235 vehicles, 154,619 drivers. And the two files’ June 2026 trip sums land close but not together — 7,511,070 trips summed over vehicles, 7,211,950 summed over drivers, a gap of 299,120. Both are the companies’ own reports; we print both and adjudicate neither. A register is a mirror the industry holds up to itself, and mirrors this size wobble.
A third of the fleet rode zero
The zero-trip third deserves its exact frame. A vehicle appears in a monthly report under one condition, in the portal’s words: “the vehicle was eligible for trips in Chicago in that month for at least one day, regardless of whether it actually provided any rides.” Under that definition, 33,278 of June 2026’s 97,695 vehicles — 34.1 percent — reported zero trips, and 238 more carry no trip figure at all. The register also counts the moonlighters: 19,008 vehicles — one in five — are flagged as reported by more than one company in the same month, with the file’s own hedge attached: “the matching process is imperfect so not all such vehicles are necessarily identified.” The companies themselves go unnamed in the data; the portal says only that “there have been four TNPs licensed to operate in Chicago, although never more than three at any given time and currently three.”
June by June: the arc of the fleet
| June of | Vehicles in that month’s reports |
|---|---|
| 2015 | 46,352 |
| 2016 | 91,555 |
| 2017 | 117,607 |
| 2018 | 126,861 |
| 2019 | 120,884 |
| 2020 | 78,976 |
| 2021 | 54,047 |
| 2022 | 68,912 |
| 2023 | 86,290 |
| 2024 | 97,358 |
| 2025 | 101,504 |
| 2026 | 97,695 |
The portal notes some Q2 2018 records were reported for the quarter as a whole and assigned to June 2018, advising that “some caution in interpreting this month and the quarter as a whole is advised.” Read the 2018 row with that in hand.
The shape: 46,352 in June 2015, a crest around 2017-2019 (the all-months peak is March 2017’s 154,235), a floor of 48,568 in March 2021, then a climb back — 101,504 by June 2025, easing to 97,695 in June 2026. Today’s fleet is 63 percent the size of its 2017 peak, in a register where 91.5 percent of vehicles carry state code IL — though 51 distinct state codes appear, including 1,579 rows reading Florida. Whether those cars winter better than the rest of us, the file does not say.
- Source: the city’s Transportation Network Providers — Vehicles file (bc6b-sq4u): 12,862,175 rows, one per vehicle per reporting month, March 2015 through June 2026, retrieved August 30, 2026. All figures are server-side aggregates of the full file; quoted lines are the portal description’s own words.
- Grain: a count for June 2026 is a count of vehicles listed in that month’s company reports — eligibility for at least one day, per the portal, not a measure of cars in service on any given day. Make, model, color, and state values are grouped case-folded, as printed otherwise.
- The drivers comparison: vehicle figures here sit beside the Drivers file (j6wf-834c) as read for our August piece; both are company-reported registers, their June 2026 trip sums differ by 299,120, and this page adjudicates neither.
- Not here: no company is named (the file names none); no vehicle-age rule or company requirement is stated — the 2009 floor is the register’s observed minimum, not a rule; no plate, VIN, or person appears in the file or on this page.
Computed by KCM Desk from the city’s rideshare vehicle register, retrieved August 30, 2026. Human-guided and edited — about this desk. If you spot an error, corrections come first.
Related Keep Chicagoland Moving coverage
- Does Chicago’s Alt-Fuel File Mean a Plug Is Always Near? 350 Public Electric Stations, Just 291 Fast Ports — and the Columns That Decide
- Chicago Transit, by the Numbers
- Chicago’s Rideshare Roster: 86,195 Driver Records in June 2026, Little More Than Half Its 2017 Peak — and a Third of Them Recorded Zero Trips
- In June 2026, a Chicago Taxi Mile Cost $4.17 and a Rideshare Mile $4.21 — and the Fare Dollar Split Opposite Ways
- Did You Know? Chicago, by Its Own Records