
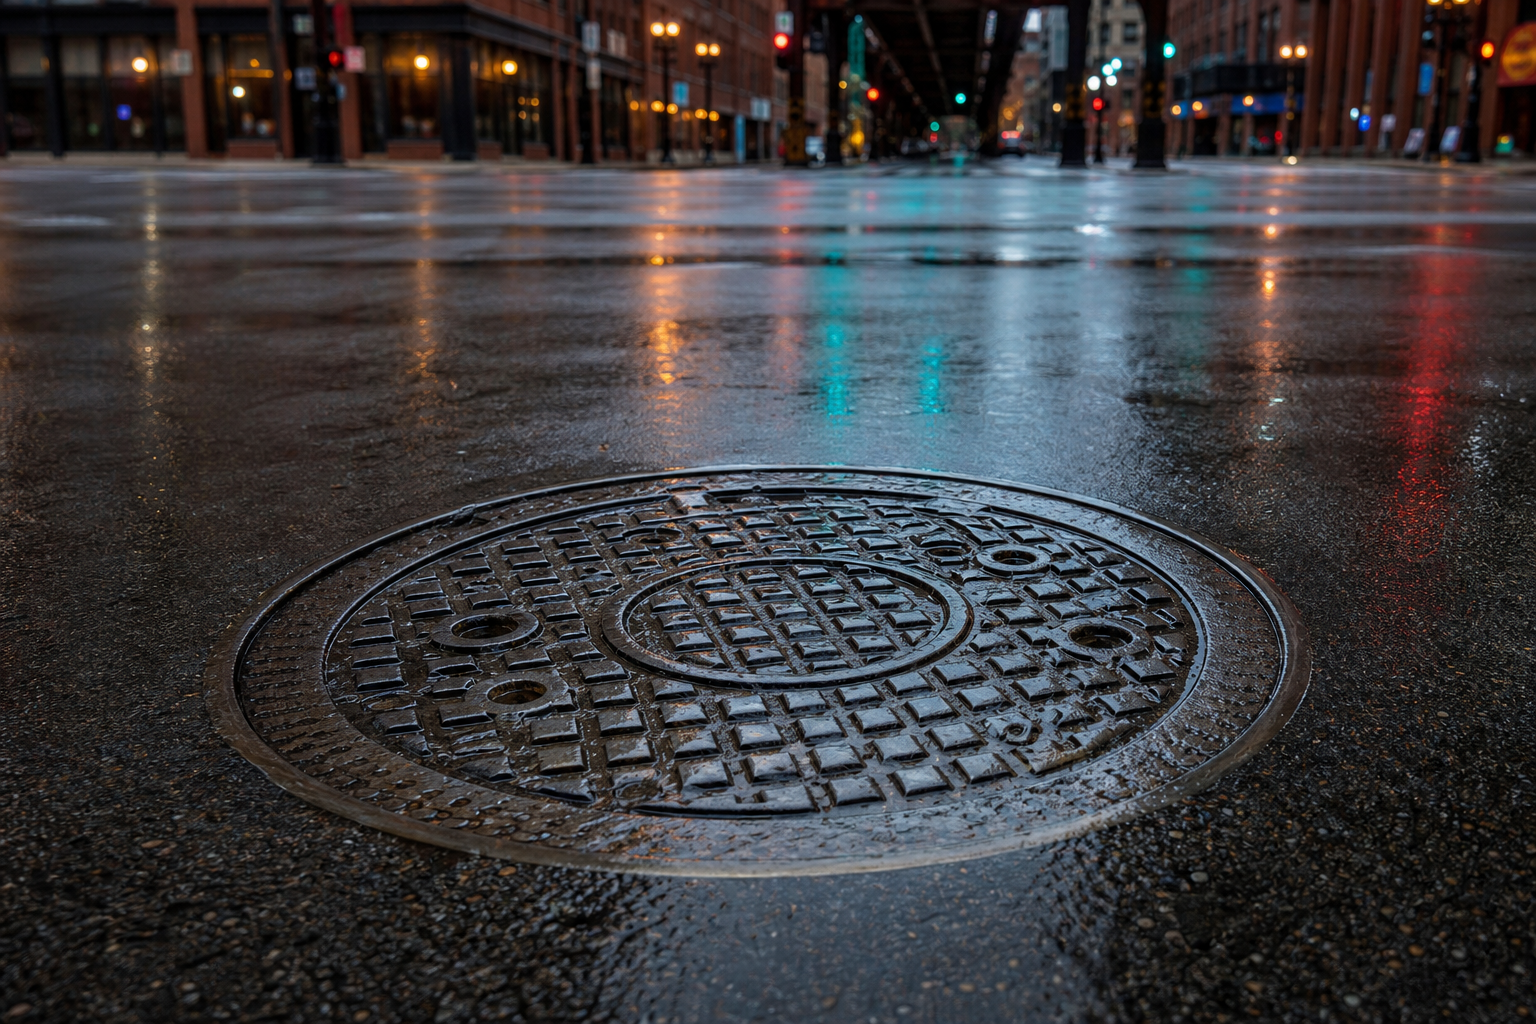

Chicago reads its sewers weekly. Since February 2022 the city has published “Concentrations of respiratory viruses in the Chicago sewer system as measured at seven sewershed sites since February 2022,” and the file now holds 6,692 site-virus-week entries for SARS-CoV-2, RSV, and influenza types A and B, across 237 weeks — not every site reports every virus every week, and the combined citywide rows are the complete set this page reads. The latest week on the file, ending August 29, 2026, reads Minimal for all four viruses on the combined citywide rows — three of the four at a value of zero. Each virus’s loudest week is on the record too, with dates, and this page prints all four of them.
Respiratory Virus Wastewater Surveillance (4tzt-ir6h), 6,692 site-virus-week rows, February 13, 2022 through the week ending August 29, 2026, retrieved September 8, 2026; the whole file was downloaded and every figure recomputed · these are virus concentrations measured in sewage — not illness counts, not case counts, and this page draws no health conclusion and makes no forecast · the file’s own weekly categories (Minimal through Very High) are used as printedSeven sewersheds, and a rule against adding them
The sampling sites read as the file names them: Racine Ave PS, 125th St PS, North Branch PS, Austin/Montclare, Chicago Lawn/Ashburn, West Pullman/Roseland, and Little Village — plus an eighth “site” numbered 999 and named All sites, which combines the seven. The description states the sampling cadence — “Generally, two samples are collected from each site during each week of the year” — and hands every reader its own counting rule: “Care should be taken when summing or otherwise aggregating rows to avoid double counting.” This page obeys it: the 948 All-sites rows and the 5,744 site-level rows are never mixed, and every figure below reads the All-sites rows only.
Four viruses, four very different ledgers
| Virus | Minimal | Low | Moderate | High | Very High |
|---|---|---|---|---|---|
| SARS-CoV-2 | 65 | 33 | 52 | 36 | 51 |
| Influenza A | 183 | 22 | 15 | 12 | 5 |
| RSV | 195 | 15 | 11 | 6 | 10 |
| Influenza B | 221 | 9 | 5 | 1 | 1 |
SARS-CoV-2 is the only virus with sizable counts in all five categories: 65 weeks Minimal, but also 51 weeks Very High — more than one week in five at the top two categories. The two influenzas concentrate at the bottom of the scale: Influenza A sits at Minimal in 183 of 237 weeks, and Influenza B in 221 — with exactly one High week and one Very High week in the entire record. Why each ledger looks the way it does is epidemiology’s question, not this file’s; the description’s own claim for the data is that “tracking this data can help predict changes in disease trends,” and that sentence is CDPH’s, not ours.
Each virus’s loudest week, dated
The highest All-sites weekly value in the whole file belongs to Influenza A: 37.9, in the week of November 20–26, 2022. SARS-CoV-2’s peak is 36.2, the week of February 12–18, 2023. RSV’s is 18.2, in the week that straddled New Year’s — December 31, 2023 through January 6, 2024. And Influenza B’s single Very High week is the newest of the four: 25.6, April 5–11, 2026, this past spring. Four peaks, four different corners of the calendar, each printed as dated and none explained — the file logs concentrations, not causes.
The week ending August 29, 2026
The newest week on the file reads Minimal across the board: SARS-CoV-2 at a weekly value of 1.7, and RSV, Influenza A, and Influenza B at zero. That is a reading of one week’s rows, not a forecast of the season ahead — the forecasting claim quoted above belongs to the description, and the weekly updates belong to CDPH’s Respiratory Illness Dashboard, which displays this same data.
- Source: the city’s Respiratory Virus Wastewater Surveillance file (4tzt-ir6h): 6,692 site-virus-week rows — site-level coverage varies, and the All-sites rows are complete at four viruses times 237 weeks — February 13, 2022 through the week ending August 29, 2026, retrieved September 8, 2026. The whole file was downloaded; every row present carries a weekly value (which rows exist varies by site, as noted); quoted lines are the portal description’s own words.
- Grain: the All sites rows (site number 999) combine the seven sampling sites, and the description warns against double counting; every category count, peak, and latest-week figure on this page uses All-sites rows only, and site names are printed as filed.
- Values: the weekly figure quoted is the file’s weekly-average value column — the number its own Minimal-through-Very-High category labels bin; no unit is attached because the column defines none, and concentration columns are left to the file.
- Not here: no illness, case, or hospitalization figure; no health conclusion; no forecast; no cause for any peak. This dataset replaces an earlier COVID-19 wastewater file, per its own description, and the succession is the portal’s to document.
Computed by KCM Desk from the city’s wastewater-surveillance file, retrieved September 8, 2026. If you spot an error, corrections come first.
Related Keep Chicagoland Moving coverage
- How Chicago Works, by the Numbers
- West Nile Season Is Surging in Chicago’s Trap Ledger: 187 Positive Pools So Far, the Fourth-Most at This Point in Twenty Seasons
- Chicago’s New Air-Sensor Network, Its First 391 Days: 102,907 Sensor-Days, a Median Day Near 9 Micrograms — and Two July 2026 Days When the Network-Wide PM2.5 Mean Hit 133 and 168
- Did You Know? Chicago, by Its Own Records