
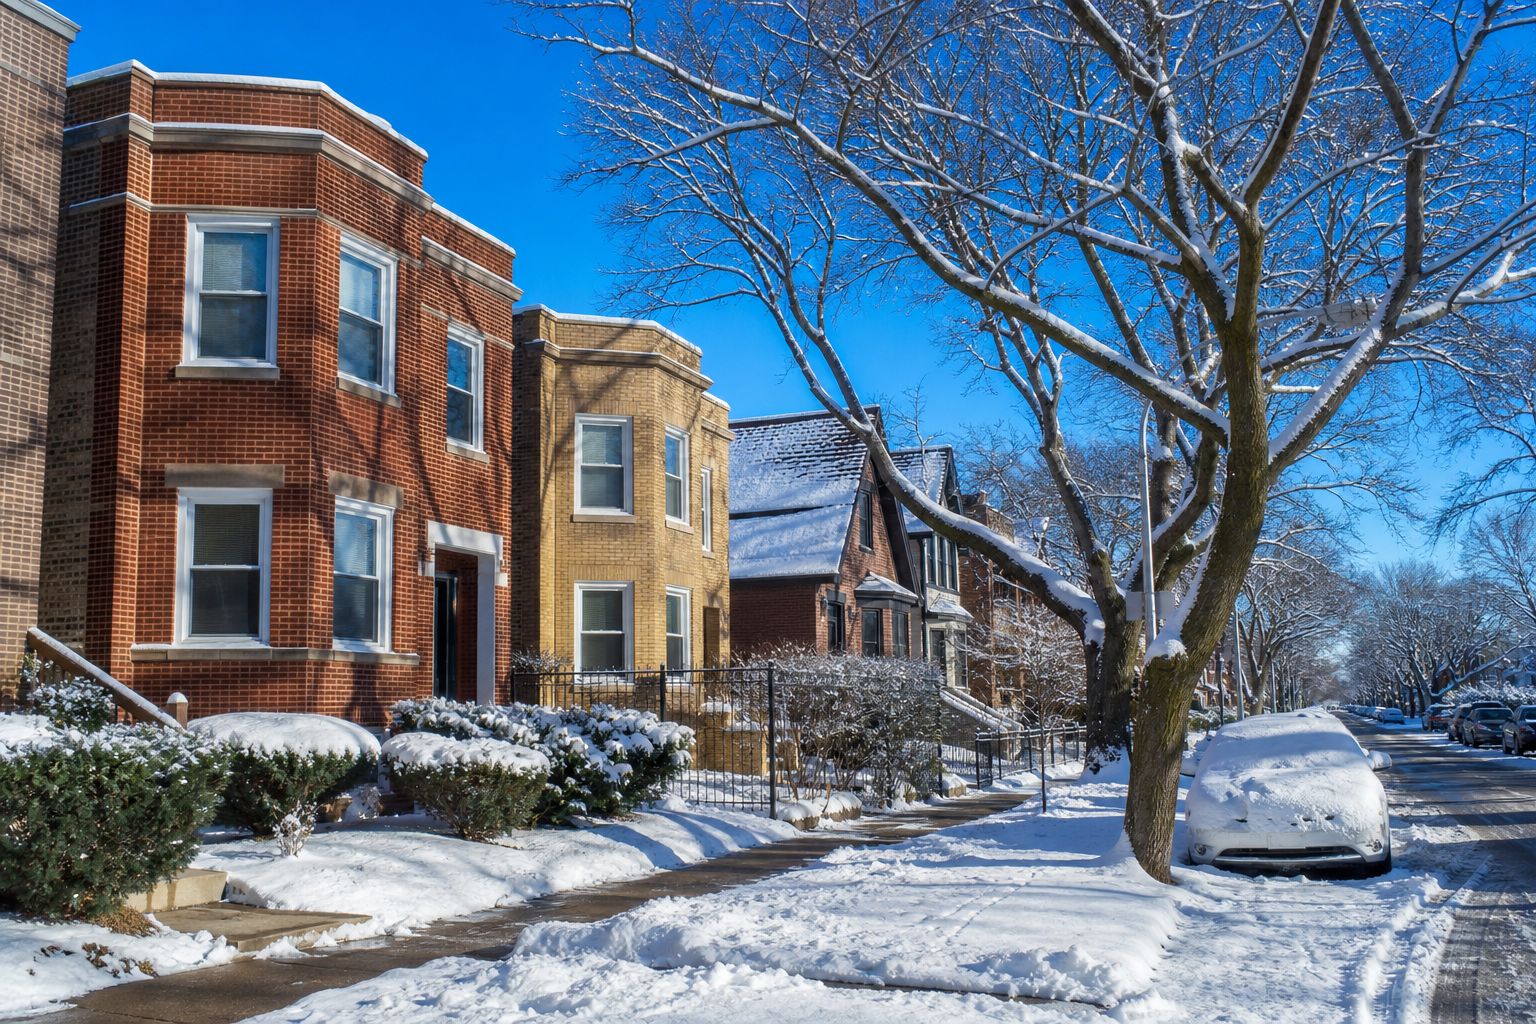

A typical Chicago winter brings about 35 inches of snow at O’Hare, and three of the last four fell well short: 2024–25 got 17.6 inches, the least in 64 complete winters of NOAA’s daily record there since 1959. The cold has eased more than the snow. Since 1990 the typical winter has had 5 days at or below zero, against 13 from 1958 to 1990.
NOAA NCEI daily summaries for O’Hare (USW00094846), January 1, 1958 to October 3, 2026 · one station · the medians and comparisons are oursHow much snow does Chicago get?
About 35 inches in a typical winter, counting from July to June. That is the median of 64 complete winters at O’Hare since 1959–60; the average is 38.2, pulled up by a few huge winters. The range is wide. The most snow came in 1978–79, 83.7 inches, and 2013–14 nearly matched it at 82.0; the least came in 2024–25, 17.6. The three winters from 2022–23 through 2024–25 all rank among the four least snowy on file, with 2011–12 the other, and last winter, 2025–26, came back to 34.1 inches, about a typical year.
| Winter | Snowfall at O’Hare | Biggest day | Days with an inch or more |
|---|---|---|---|
| 2025–26 | 34.1 in | 8.4 in, November 29, 2025 | 10 |
| 2024–25 | 17.6 in | 2.9 in, November 21, 2024 | 7 |
| 2023–24 | 22.2 in | 4.7 in, January 12, 2024 | 8 |
| 2022–23 | 20.2 in | 3.6 in, January 25, 2023 | 8 |
| 2021–22 | 32.8 in | 5.4 in, February 2, 2022 | 10 |
| 2020–21 | 48.8 in | 6.3 in, January 31, 2021 | 13 |
| 2019–20 | 34.8 in | 3.4 in, November 11, 2019 | 15 |
| 2018–19 | 49.5 in | 5.4 in, April 14, 2019 | 16 |
| 2017–18 | 36.1 in | 6.2 in, February 9, 2018 | 12 |
| 2016–17 | 26.1 in | 6.4 in, December 4, 2016 | 7 |
| 2015–16 | 31.2 in | 7.0 in, November 21, 2015 | 10 |
When does it snow in Chicago?
Mostly in January. In a typical winter January brings 10.2 inches, February 7.8, December 5.8 and March 4.0; November’s median is under an inch and April’s a trace. The medians for each month don’t add up to the season’s, because the snowy months move from winter to winter. When the first snow and the first freeze tend to arrive is on our first freeze and first snow page.
What were Chicago’s biggest snowstorms?
Measured over two days at O’Hare, four storms reached 18 inches or more: January 1–2, 1999 (20.6 inches), the blizzard of January 26–27, 1967 (20.4), the Groundhog Day blizzard of February 1–2, 2011 (20.2) and February 1–2, 2015 (18.0). The most in a single calendar day was 18.6 inches on January 2, 1999. These are O’Hare’s readings; other stations in the region measured some of the same storms differently.
What is the coldest temperature ever recorded in Chicago?
In O’Hare’s daily record, which starts in 1958, the lowest reading is -27°F, on January 20, 1985. Two other winters of the early 1980s came close: -26°F on January 10, 1982 and -25°F on December 24, 1983. The coldest since then came in the polar vortex of January 2019, -23°F on January 30, 2019. Last winter’s low was -11°F.
Are Chicago winters getting milder?
For cold, yes, by this record. From 1958–59 to 1989–90 the typical winter had 13 days at or below zero; since 1990–91 it has had 5. The coldest reading of a typical winter went from -14°F to -8°F. The most days at or below zero in one winter was 35, in 1962–63, and two winters had none at all, 1982–83 and 2011–12.
Snow has changed less. The typical winter brought 36.2 inches from 1959–60 to 1989–90 and 34.1 since. That difference is small next to the change from one winter to the next: the median gap between back-to-back winters is 13 inches. Our reading: a Chicago winter now is less likely to be bitterly cold than a generation ago, but about as likely to be snowy, and the run of light winters from 2022–23 to 2024–25 ended with a typical one.
What this record can’t tell you
- On the recordHow much snow fell and how cold it got at O’Hare, day by day, since 1958, as NOAA publishes it.
- Not establishedWhat fell on any other street. Snow from the lake can bury the shore and spare O’Hare, and the reverse; one station is one place.
- Not establishedThis winter’s forecast. A long record says what is typical, not what comes next.
- Not establishedWhy winters changed. The record shows the change; it does not explain it.
How we counted
- Source. NOAA National Centers for Environmental Information, Global Historical Climatology Network daily summaries for O’Hare (station USW00094846), January 1, 1958 to October 3, 2026: daily snowfall in inches and daily low and high temperatures in degrees Fahrenheit.
- Winters. A snow season runs July 1 to June 30 and is named for its fall; a cold season runs November 1 to March 31. A season counts only if 95 percent of its days carry a reading, which leaves out the snow seasons 1995–96 to 1997–98. The record starts January 1, 1958, so the first complete cold season is 1958–59 (November 1958 to March 1959) and the first complete snow season 1959–60.
- Measures. A day at or below zero has a low of 0°F or colder. Two-day storm totals add the snowfall of two calendar days in a row. “Typical” means the median. The gap between back-to-back winters is the difference in snowfall between each winter and the one before it, for the 62 consecutive pairs on file.
Computed by KCM Desk from NOAA’s daily record for O’Hare, read October 30, 2026. Human-guided and edited — about this desk. If you spot an error, corrections come first.
Related Keep Chicagoland Moving coverage
- Chicago’s First Freeze at O’Hare Moved From a Median October 12 to October 28 Between 1966–1995 and 1996–2025. The Frost-Free Season Grew to 185 Days
- Chicago’s Winter Parking Ban Covers 20 Stretches of 18 Streets From 3 to 7 a.m., Dec. 1 to April 1, Snow or Not. O’Hare Gets Two Inches of New Snow on About Five Days a Winter