
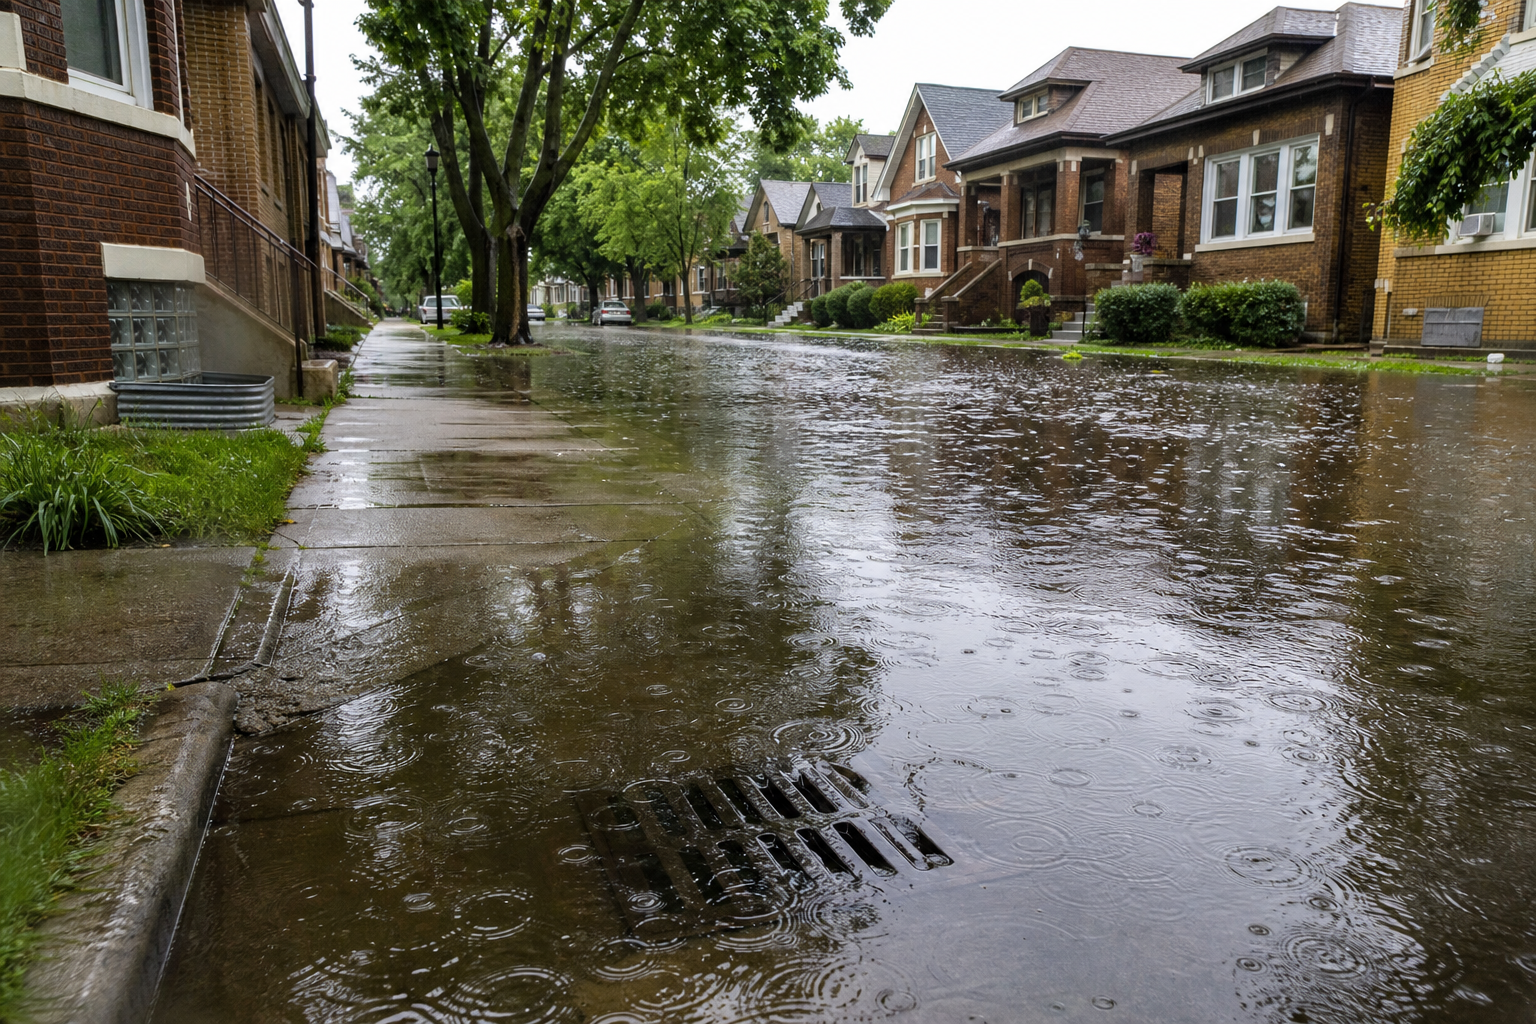

Chicago’s 311 file holds 69,852 “Water in Basement” requests since the current system began recording them in December 2018 — and they arrive the way the rain does. One day, August 17, 2025, holds 3,783 of them, 5.4 percent of every such request in nearly eight years; the twenty busiest days hold a third; July and August together hold half. Austin leads the city’s 77 community areas at 8,207 requests, and every one in the file is owned by the Department of Water Management. These are requests, not verified floods, and the request type exists, by the city’s own definition of it, for water backing up rather than water coming through the windows. That boundary, and the one about what “Completed” means here, run through everything below.
311 Service Requests, Chicago data portal · updated daily · 69,852 Water in Basement Complaint rows retrieved August 20, 2026One row, one request
The city’s 311 Service Requests file carries one row per request, and for this service type the request number is unique on every one of the 69,852 rows — no row inflation to collapse. The file’s own duplicate flag marks 3,155 of them, 4.5 percent, as duplicates of another request; they are kept in every count here and stated once. The owner-department column takes one value across all 69,852 rows: the Department of Water Management. And the city’s service-page definition of the type is narrower than the phrase suggests — it is for reporting a backup of water, it asks where the water is coming from and how many inches have backed up so that a sewer crew can be dispatched, and it says not to use it for water that came in through the windows. Of the 69,852, the file marks 64,766 Completed (93 percent), 4,865 Canceled, and 221 still Open at retrieval. By the file’s origin column, 33,347 of them (48 percent) came in by phone call and 20,399 (29 percent) online; 8,268 — 12 percent — came in through an alderman’s office, and 7,227 through the mobile app.
The storm days
- August 17, 2025(the file’s busiest day)3,783
- July 5, 20232,091
- August 18, 20251,749
- July 2, 20231,483
- July 3, 20231,411
- August 19, 20251,397
- July 6, 20231,238
- September 11, 20221,081
- July 4, 2023907
- August 20, 2025887
The file holds requests on 2,722 distinct days, and its shape is a handful of spikes on a low floor. The ten busiest days all fall inside three stretches — August 17–20, 2025; July 2–6, 2023; and September 11, 2022 — and the twenty busiest days together hold 23,238 requests, 33 percent of everything since 2018. The file records no weather, so the link to rain is not in the data; it is consistent with the National Weather Service’s Chicago office, which logged August 16–17, 2025 as a severe-weather and flash-flooding event with rain rates reaching 4.5 inches an hour early on the 17th, and published an event review of the July 2, 2023 flash flood. The requests on those dates are the city’s record of what residents reported; the storms are the weather service’s record of what fell.
The year arc
- 20194,532
- 20206,207
- 2021(the quietest full year)4,174
- 20227,404
- 202317,450
- 20244,227
- 2025(the busiest)19,279
- 2026(through Aug 20)6,575
The file opens with four rows in the last days of 2018, so the arc reads from 2019. Two years carry it: 2023 at 17,450 requests and 2025 at 19,279 — together 53 percent of every request in the file — with 2024 between them at 4,227, barely above the quietest full year, 2021, at 4,174. A year’s total here is mostly a question of whether one of those storm stretches landed in it. July 2023 alone holds 13,591 requests, 19 percent of the whole file in a single month; August 2025 holds 11,302.
The calendar
Stacking every year onto one calendar, July holds 21,778 requests, 31 percent of the file, and August 14,135 — the two months together are 51 percent. November is the quietest month at 1,364 across all eight years. The winter months are not empty: January carries 3,227 and March 3,691, which the file does not explain and this page does not guess at.
Where the requests came from
- Austin8,207
- Chicago Lawn4,720
- Gage Park2,748
- West Lawn2,421
- Garfield Ridge2,285
- Roseland2,185
- Portage Park2,174
- Auburn Gresham1,857
- Chatham1,714
- West Pullman1,588
Every community area’s count, in text
Austin 8,207; Chicago Lawn 4,720; Gage Park 2,748; West Lawn 2,421; Garfield Ridge 2,285; Roseland 2,185; Portage Park 2,174; Auburn Gresham 1,857; Chatham 1,714; West Pullman 1,588; Washington Heights 1,555; Greater Grand Crossing 1,490; Belmont Cragin 1,412; West Englewood 1,396; Humboldt Park 1,367; West Garfield Park 1,293; Clearing 1,232; Ashburn 1,203; South Shore 1,183; Calumet Heights 1,125; Mount Greenwood 1,049; North Lawndale 1,039; Morgan Park 963; West Ridge 946; South Chicago 918; Avalon Park 897; Dunning 892; Beverly 885; Forest Glen 839; Norwood Park 827; West Elsdon 810; Edgewater 801; South Lawndale 785; Irving Park 784; Rogers Park 747; Albany Park 745; Englewood 706; Archer Heights 689; West Town 667; New City 648; Logan Square 612; South Deering 568; Jefferson Park 536; Lincoln Square 475; Brighton Park 468; Lake View 430; Pullman 419; East Side 399; Woodlawn 390; Lincoln Park 370; Avondale 362; Near West Side 358; East Garfield Park 356; Uptown 340; North Park 321; Grand Boulevard 318; North Center 311; Hermosa 294; Lower West Side 290; Edison Park 248; Loop 240; Bridgeport 223; Montclare 200; Hegewisch 172; Near North Side 172; Washington Park 135; Kenwood 130; Near South Side 114; Burnside 112; McKinley Park 111; Hyde Park 109; Riverdale 109; Douglas 95; Armour Square 80; Fuller Park 64; Oakland 56; O’Hare 20.
Austin leads at 8,207 requests, 12 percent of the file, and the rest of the top ten is mostly the Southwest and Far South Sides: Chicago Lawn (4,720), Gage Park (2,748), West Lawn (2,421), Garfield Ridge (2,285), Roseland (2,185), then Portage Park on the Northwest Side (2,174), Auburn Gresham, Chatham, and West Pullman. O’Hare has 20. These are counts of requests, not rates: areas differ in how many basements they hold and in how readily residents report, and the file carries neither figure, so a large count says an area generated many requests and nothing finer than that.
The closing clock
Measured on the file’s own two timestamps, the median Completed request was closed about nine hours after it was created in 2023, about twenty hours in 2019, and in 2025 — the busiest year — in under two hours, with the slowest tenth closed within 1.6 days. What a closed request means is the thing the file does not say: it records a status, not a finding. The city’s service page says the request dispatches a sewer crew; the file does not record what the crew found, whether the water was the sewer’s or the building’s, or when the basement was dry. A closing time here is how long the request stayed open in the 311 system, and our reading of the big 311 types treats every such clock the same way.
If you are checking a building or a block
The counts above describe the city; the record that describes a particular address is the same file, and it is public. The 311 dataset on the city’s data portal can be filtered by service type and by address, so the water-in-basement history of a block since December 2018 is a lookup, not a guess — with the caveat that it shows requests, and a building whose owner never filed one is absent from it. The city’s own basement-flooding page describes the mechanism in its words — sewer mains fill during intense storms and water pushes into basements through private drains — and describes what the city does (flow restrictors in catch basins) and what it recommends to owners (disconnecting downspouts from the sewer); that page, not this one, is the current word on both. Two of our numbers bear on any such check: the storm-day concentration means an area’s count is driven by whether the worst days hit it, and the area table shows where the requests have clustered. What these records cannot tell you is whether a given basement flooded, how badly, or why; they can tell you how many times someone at an address or in an area filed a request about water backing up, and on what days. The city’s page puts the limit plainly: “Nobody can guarantee you will never flood.”
Known limits
This is a ledger of requests under one 311 service type, as the city defines it — water backing up, reported by someone who chose to report it. It is not a count of flooded basements, of damage, or of sewer performance, and a sibling type, Water On Street Complaint, holds 80,549 requests of its own that are never blended in here. The file begins in December 2018 with the current 311 system; older requests live in a separate historical file and are not counted. Status values are the file’s, undefined in the file itself. Community-area figures are counts, not rates. The file updates daily; every figure is a snapshot of the August 20, 2026 retrieval.
- Source 311 Service Requests (v6vf-nfxy, Chicago data portal), rows with service type Water in Basement Complaint: 69,852 at retrieval on August 20, 2026, created December 19, 2018 through the retrieval date. The service type’s definition is the city’s own Water in Basement service page.
- Counting One row is one request; the request number is unique on every row. Year, month, and day tables use the created timestamp. Elapsed figures measure created-to-closed spans in calendar days for requests marked Completed, with medians and 90th percentiles per request year; no span was negative. Status, duplicate-flag, and origin values are the file’s own. Percentages are computed from raw counts.
- Geography Each request is counted in the community area recorded in the file’s own community_area column. Before using it we placed every request’s recorded coordinates against the city’s community-area boundary polygons (Boundaries – Community Areas, igwz-8jzy) by point-in-polygon; the file’s column and our placement agreed on 69,773 of the 69,780 rows that had both, so the file’s column is used. 53 rows carry no community area.
- Weather The file records no weather. The two storm references are the National Weather Service Chicago office’s own event pages for August 16–17, 2025 and July 2, 2023, cited as consistent with the request dates, not as a cause the file records.
Computed by KCM Desk from records retrieved August 20, 2026. Human-guided and edited — about this desk. If you spot an error, corrections come first.
Related Keep Chicagoland Moving coverage
- Chicago’s Deep Tunnel, by MWRD’s Own Records: 1.55 Trillion Gallons Pumped Back in 28 Logged Years, $3.86 Billion in Contract Dollars — and the Last Reservoir Stage Has Slipped From 2029 to 2032
- The 10 Chicago Community Areas With the Most Water-in-Basement 311 Requests Since 2018
- How Chicago Works, by the Numbers
- Chicago’s Big 311 Request Types, Ranked by How Fast the City Closes Them
- Chicago’s Patch Ledger Records 2.76 Million Potholes Filled Since 2018 — and 2026 Has Already Out-Filled All of 2025