
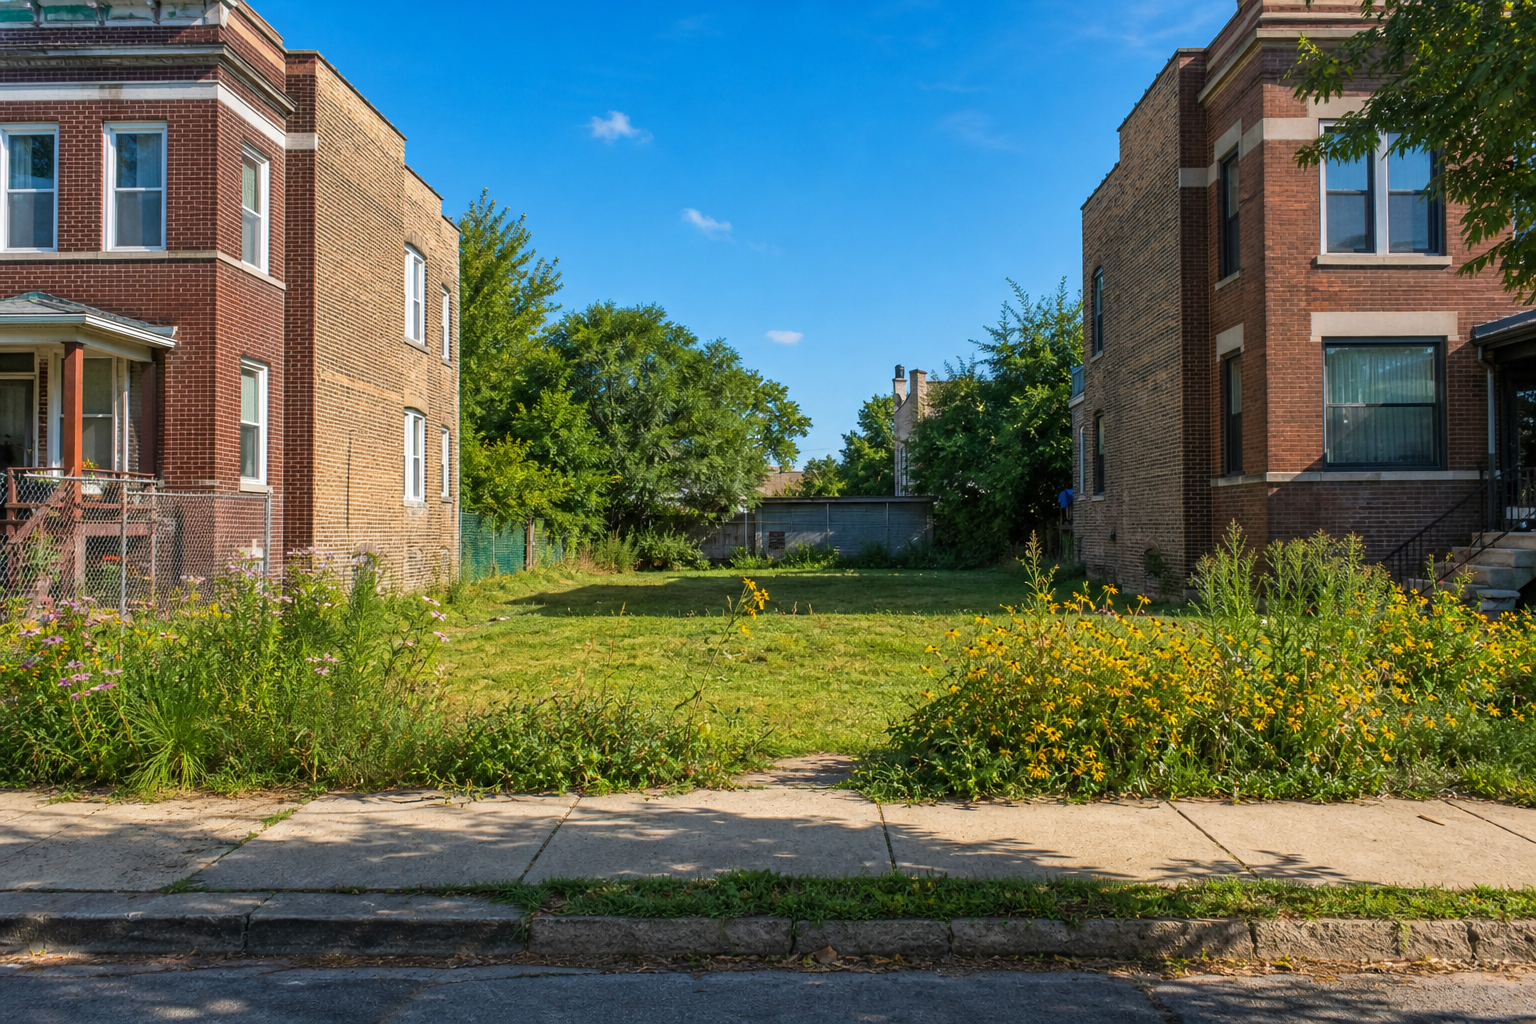

Chicago’s own land inventory listed 12,110 parcels as city-owned on August 3, 2026 — and one community area, Englewood, holds more of them than any other: 1,312. Its neighbor West Englewood is second at 992; together the two South Side areas hold a fifth of the 11,273 listed parcels the file places in a community area. Below are the ten community areas with the most city-listed parcels, from the inventory the city itself publishes; our full analysis covers how parcels leave the inventory, how long the city holds them, and the key caveats that come with a self-reported list. These are records of ownership, and this page takes no position on where anyone should live or invest.
1. Englewood — 1,312 parcels listed
The inventory lists 1,312 city-owned parcels in Englewood as of August 3, 2026 — 11.6 percent of all listed parcels with a community area, the No. 1 count among the 74 community areas the file reaches. Englewood’s count alone exceeds the combined counts listed in the 40 community areas with the fewest.
2. West Englewood — 992 parcels listed
The inventory lists 992 city-owned parcels in West Englewood as of August 3, 2026 — 8.8 percent of all listed parcels with a community area, the No. 2 count among the 74 community areas the file reaches.
3. New City — 795 parcels listed
The inventory lists 795 city-owned parcels in New City as of August 3, 2026 — 7.1 percent of all listed parcels with a community area, the No. 3 count among the 74 community areas the file reaches.
4. North Lawndale — 773 parcels listed
The inventory lists 773 city-owned parcels in North Lawndale as of August 3, 2026 — 6.9 percent of all listed parcels with a community area, the No. 4 count among the 74 community areas the file reaches.
5. Grand Boulevard — 555 parcels listed
The inventory lists 555 city-owned parcels in Grand Boulevard as of August 3, 2026 — 4.9 percent of all listed parcels with a community area, the No. 5 count among the 74 community areas the file reaches.
6. East Garfield Park — 526 parcels listed
The inventory lists 526 city-owned parcels in East Garfield Park as of August 3, 2026 — 4.7 percent of all listed parcels with a community area, the No. 6 count among the 74 community areas the file reaches.
7. West Pullman — 473 parcels listed
The inventory lists 473 city-owned parcels in West Pullman as of August 3, 2026 — 4.2 percent of all listed parcels with a community area, the No. 7 count among the 74 community areas the file reaches.
8. Washington Park — 459 parcels listed
The inventory lists 459 city-owned parcels in Washington Park as of August 3, 2026 — 4.1 percent of all listed parcels with a community area, the No. 8 count among the 74 community areas the file reaches.
9. South Chicago — 375 parcels listed
The inventory lists 375 city-owned parcels in South Chicago as of August 3, 2026 — 3.3 percent of all listed parcels with a community area, the No. 9 count among the 74 community areas the file reaches.
10. Austin — 370 parcels listed
The inventory lists 370 city-owned parcels in Austin as of August 3, 2026 — 3.3 percent of all listed parcels with a community area, the No. 10 count among the 74 community areas the file reaches.
Questions these numbers can answer
Which Chicago community area has the most city-owned lots? Englewood, with 1,312 parcels listed as city-owned on August 3, 2026, followed by West Englewood at 992. None of the ten areas on this list is on the North Side.
How many parcels does Chicago list as city-owned? The inventory listed 12,110 parcels as city-owned on August 3, 2026 — 11,273 of them placed in a community area, plus 837 records without one. The inventory counts parcels, not acreage — parcel sizes vary, and the file does not total them — and it is the city’s own list; our full analysis details what its status fields capture.
How many city lots are for sale? Of the 12,110 listed parcels, the file marked 874 — about one in fourteen — with the sale status “Offered” as of the same date. What the other status values mean, and how many parcels actually left city hands each year, is in the full analysis.
Where these numbers come from
City of Chicago City-Owned Land Inventory (aksk-kvfp), pulled August 3, 2026, counting rows with property status “Owned by City”; rows marked not-city-owned or blank are excluded from every figure. The inventory is the city’s own list — a parcel appears the way the file records it, and the full analysis documents the completeness notes that come with it, including columns the portal added in 2023. Ranked areas all clear the analysis’s display floor of 100 parcels — areas under it are not ranked. The hold-time record, the sale pipeline, and the key caveats: Chicago’s Land Inventory Lists 12,110 Parcels as City-Owned.
Computed by KCM Desk from records current to August 3, 2026. Human-guided and edited — about this desk. If you spot an error, corrections come first.