
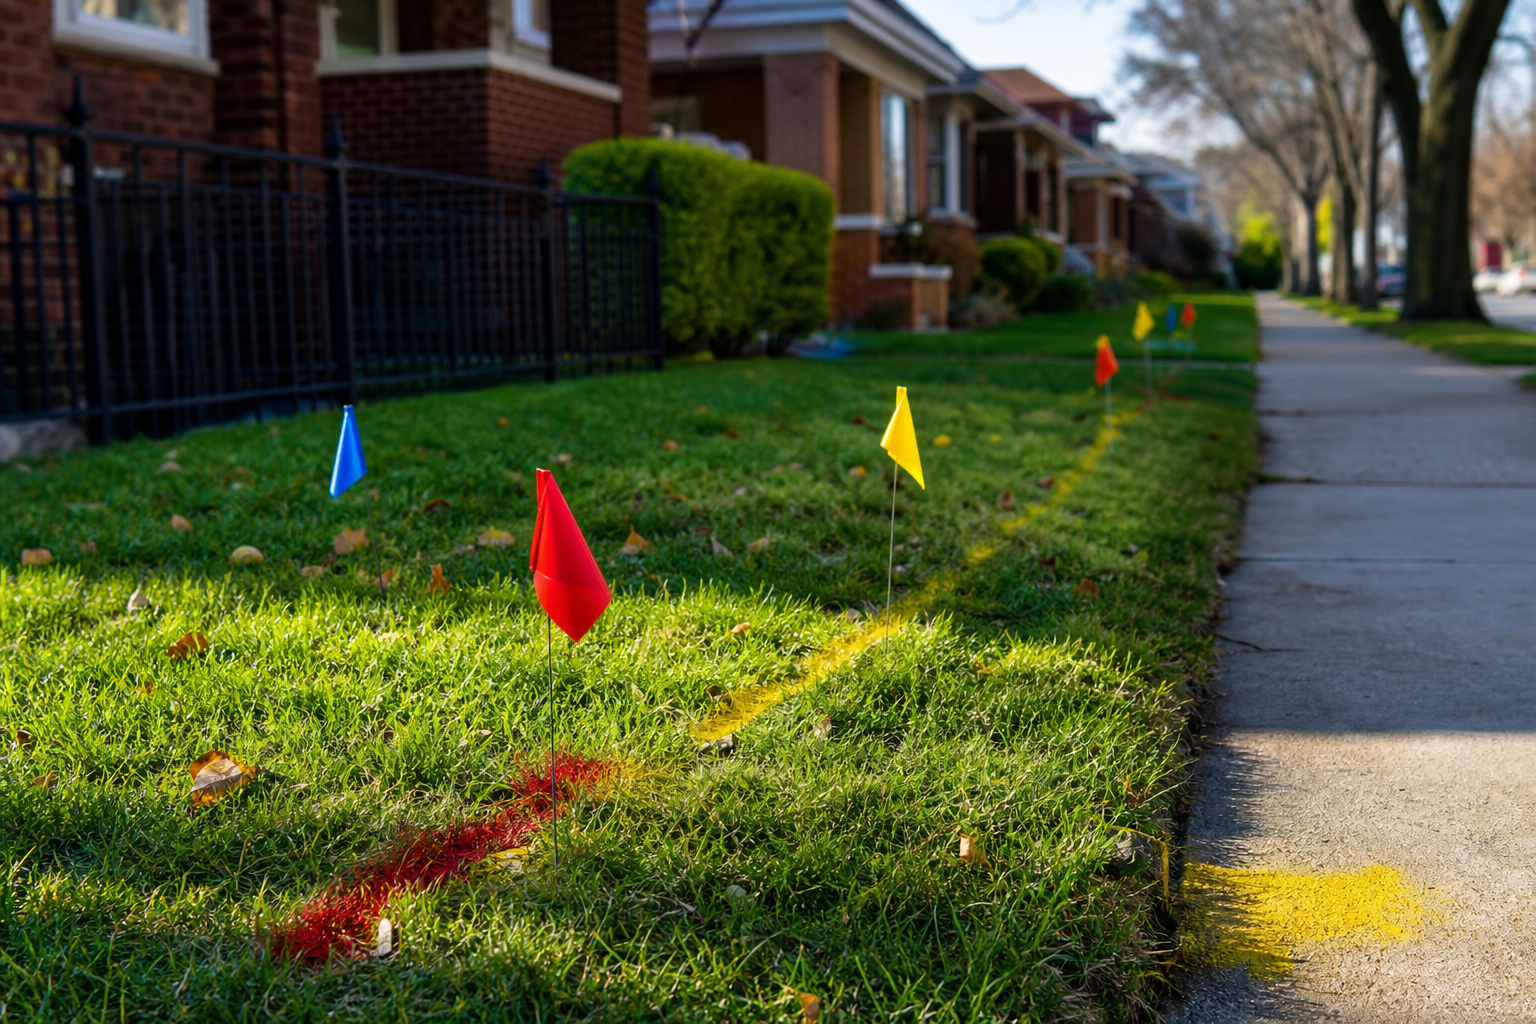

Planning a fence post, a tree, a deck footing? In this city that plan has a paper shadow: “Anyone planning to dig within Chicago must obtain a “dig ticket” from 811 Chicago,” says the file’s own description. 811 Chicago is the Chicago Department of Transportation’s service, which that description calls “a free, 24-hour service to private contractors and homeowners in Chicago.” Every ticket then fans out as notices to the utilities whose pipes and cables might be in the way, and this file is that fan-out, kept whole: 18,091,229 utility notifications from January 2018 through August 29, 2026. Before the shovel, the switchboard. The busiest ticket year on the file is 2023 — 191,071 distinct dig tickets, drawing 12.3 notices each — and the single most-notified name on the list is Peoples Gas, at 4,561,442 notices: one in four.
Dig Ticket Notifications (cygx-ui4j), 18,091,229 rows, January 2018 through August 29, 2026, retrieved September 1, 2026 · one row per utility notification — the same dig ticket appears many times, so ticket figures here are per-year distinct counts · the file’s person-name columns were never selected · a dig ticket itself is obtained through the city’s Digger portal, linked in the file’s own descriptionOne call, a dozen notices
The file warns you about itself, and the warning is the key to every number on this page: it “cannot be used without further refinement to count, map, or analyze unique excavations.” One excavation, many rows. So we count at ticket grain, one year at a time — and we never add the years together, because a ticket that lives across a year boundary would be counted twice. The fan-out itself has drifted: a 2018 ticket drew 14.2 notices on average; 2023’s drew 12.3; 2024’s, the gentlest year, 11.2. Why the fan narrows — fewer utilities per block, different ticket shapes — the file doesn’t say, and neither will we.
| Year | Distinct dig tickets | Utility notifications | Notices per ticket |
|---|---|---|---|
| 2018 | 184,568 | 2,627,728 | 14.2 |
| 2019 | 180,962 | 2,427,172 | 13.4 |
| 2020 | 153,337 | 1,966,812 | 12.8 |
| 2021 | 178,084 | 2,183,541 | 12.3 |
| 2022 | 162,121 | 2,099,746 | 13.0 |
| 2023 | 191,071 | 2,342,071 | 12.3 |
| 2024 | 153,508 | 1,724,141 | 11.2 |
| 2025 | 131,702 | 1,569,660 | 11.9 |
| 2026 | 94,485 | 1,150,358 | 12.2 |
2023 stands as the file’s busiest ticket year at 191,071; 2025, at 131,702, sits 59,369 below it. 2026 holds 94,485 through August 29. Those are readings, not a forecast.
Who gets told: the city’s phone tree, ranked
Seventy-five utility labels appear as notice recipients. The leader is printed in the file as “Peoples Gas*” — asterisk and all; what the asterisk marks, the file doesn’t say — with 4,561,442 notifications, 25.2 percent of every notice in the file. The second name on the roster is the City itself: the label “City of Chicago (CoC)” received 2,318,388 notices, 12.8 percent. Which city facilities that label covers, the file doesn’t say; it only ranks it second. AT&T sits third at 2,296,141. The file keeps ComED as two labels, South (1,235,867) and North (1,079,573); sum them — our arithmetic — and the 2,315,440 total lands just 2,948 notices behind the City itself. Further down the roster, exactly as printed: “Rogers Telecom/Gabe’s Technical Service,” 999,050 notices.
The 48-hour promise, and its paper trail
The description states the clock: utility owners “mark the location of the underground facilities within 48 hours (excluding emergencies), not counting Saturdays, Sundays, and holidays.” The file then logs how each notice fared, in two different columns that must not be confused. The notice-type column tallies 10,954,565 rows as Initial ticket — 60.6 percent — alongside 3,986,253 renewal notifications, 1,670,118 remark requests, 341,511 cancellation notices, and two labels a digger never wants: “No-show notification” (223,074 rows) and “Incomplete marking notice” (41,666). The separate status column distributes differently: 82.7 percent of all notices stand at Acknowledged, 1,613,094 at Positive Response/Clear, 1,489,537 at Marked, 17,981 at Unacknowledged, 3,617 at In Route — and a status also named “No Show,” which counts just 114. Same words, different column, different tally: we count each as filed and merge nothing.
Emergencies are the exception, in the file as in the rule
The 48-hour clock above carries its own carve-out — “excluding emergencies” — and the file shows how exceptional emergencies are: 509,166 notification rows flagged emergency, 2.8 percent of the file. At ticket grain, each complete year from 2018 through 2025 holds between 6,049 (2020) and 8,462 (2018) distinct emergency tickets; 2026 holds 5,250 through August 29.
Where the notices fall thickest
Count notification rows by street name and the roll call is the city’s long spines: Western (244,916 rows), Ashland (196,521), Halsted (161,739), Pulaski (152,998), Clark (146,547), then Kedzie, Milwaukee, California, Damen, and Stony Island (122,493). These are counts of notices, not of excavations — the grain warning applies to streets too — but as a map of where Chicago’s digging paperwork concentrates, it is the arterial grid, drawn in notices.
The digging trilogy, three files deep
This is the request side of a story we’ve now read end to end in the city’s own records: the dig tickets here, the separate 811 damage file where reported utility hits land, and CDOT’s do-not-dig moratorium list that closes fresh pavement to shovels. Each file keeps its own grain and its own dates; the links below hold the other two chapters.
- Source: the city’s Dig Ticket Notifications file (cygx-ui4j), retrieved September 1, 2026: one row per utility notification, January 2018 through August 29, 2026. All figures are server-side aggregates of the live file; quoted lines are the portal description’s own words.
- The row count: the portal’s cached column profile shows 9,015,520 rows, but the live file returns 18,091,229 — verified three ways, by year, by emergency flag, and by notice type, each grouping summing to the same total. We report the live count.
- Grain: the same dig ticket produces many notifications, and the description says the file “cannot be used without further refinement to count, map, or analyze unique excavations;” ticket figures are count-distinct within a single year and are never summed across years. Street and utility figures are counts of notification rows.
- Not here: the file’s person-name contact columns were never selected or read; no unique-excavation total is claimed; no cause is offered for the ticket decline after 2023; obtaining a ticket, and every rule about digging, belongs to the city’s own Digger portal.
Computed by KCM Desk from CDOT’s dig-ticket notification file, retrieved September 1, 2026. Human-guided and edited — about this desk. If you spot an error, corrections come first.
Related Keep Chicagoland Moving coverage
- How Chicago Works, by the Numbers
- Chicago’s 811 File Holds 14,508 Utility-Hit Reports Since 2015. Gas Leads — and 846 Reports Record What Was Hit as UNKNOWN.
- Chicago Keeps a Do-Not-Dig List: 14,093 Active Street Moratoriums, Doubled Permit Fees After Repaving — and One Stretch Protected Until 2207
- Did You Know? Chicago, by Its Own Records