
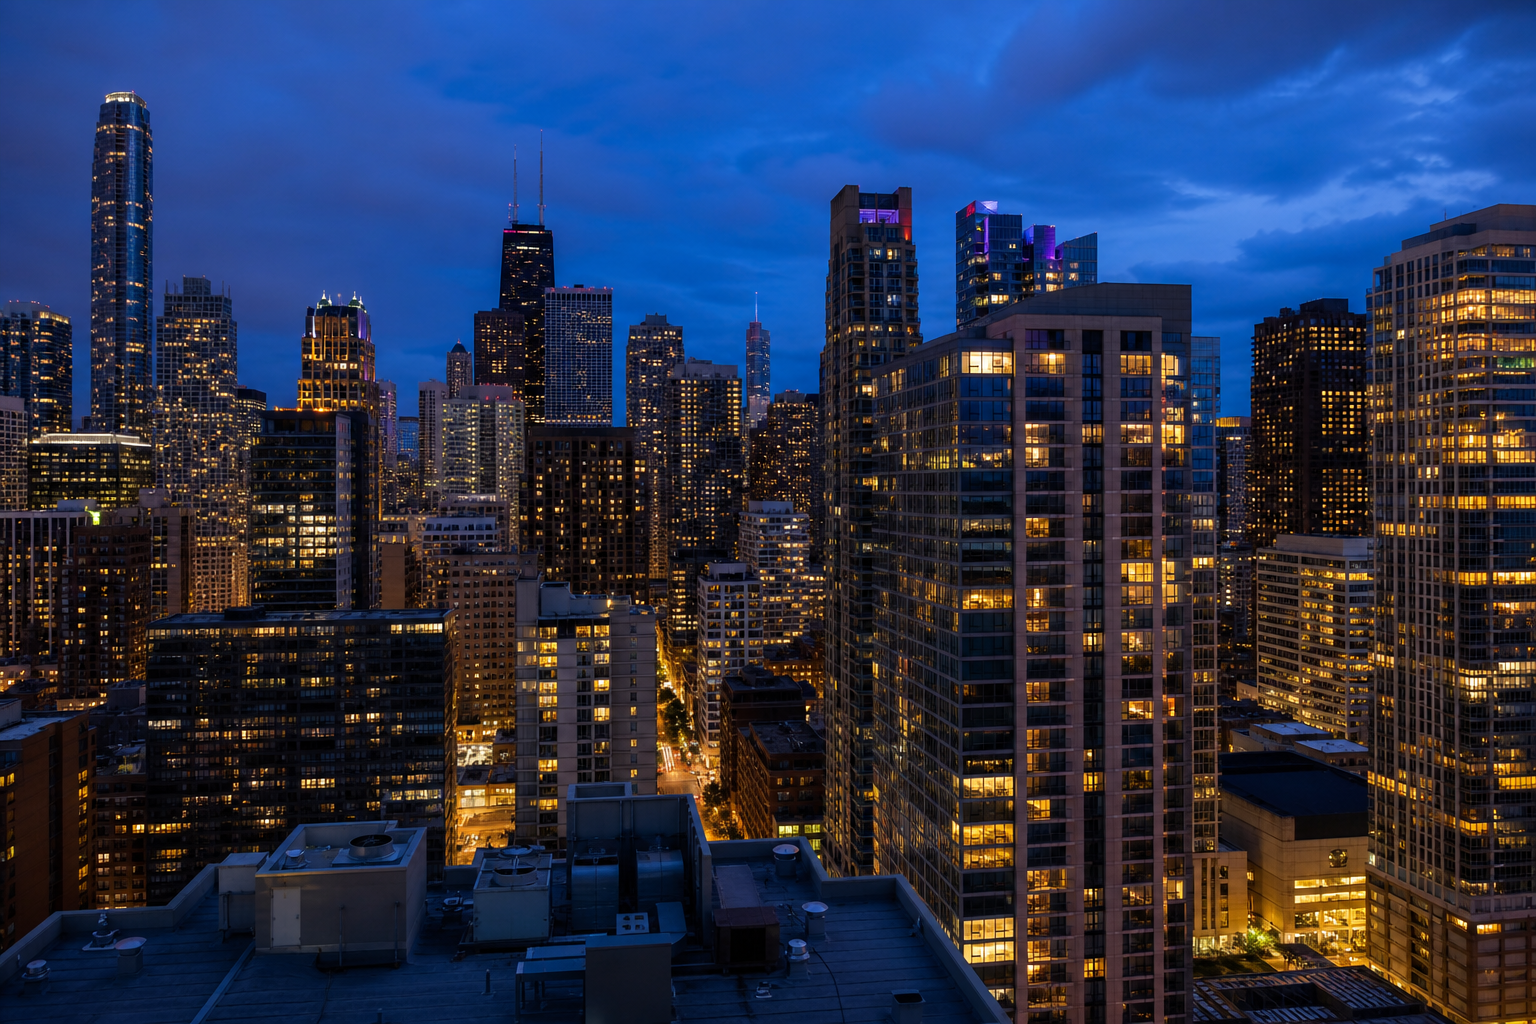

Chicago keeps a report card on its biggest buildings. The city’s energy-benchmarking ordinance — which, in the data portal’s own words, “calls on existing municipal, commercial, and residential buildings larger than 50,000 square feet to track whole-building energy use, report to the City annually, and verify data accuracy every three years” — produces a public file of one row per building per reporting year: 28,329 rows, 3,852 distinct buildings, reporting years 2014 through 2023. In the 2023 vintage, the newest in the file, 769 buildings wear the top 4-star Chicago Energy Rating and 564 wear zero stars; 2,584 covered buildings submitted their data and 542 did not; the average K-12 school’s ENERGY STAR score runs 25.3 points below the average office’s; exactly one building recorded a perfect 100; and the buildings that did file summed to 637 million square feet and 4.59 million metric tons of reported greenhouse gas. One date belongs in the first paragraph: the portal last updated this file on February 5, 2025, and 2023 is the newest reporting year it holds.
Chicago Energy Benchmarking (xq83-jr8c), 28,329 building-year rows — one row per building per reporting year — 3,852 distinct buildings, data years 2014–2023 · portal file last updated February 5, 2025 · retrieved August 25, 2026 · averages are of rows that carry the value; blanks are counted separatelyTen vintages, counted as the file labels them
The grain matters: a building that reported for eight years is eight rows, so nothing below adds rows across years into a count of buildings. Each reporting year carries its own status labels, and this page counts them exactly as printed — the file says “Submitted” in most years but “Submitted Data” in 2020 and 2022, and this table keeps the distinction rather than guessing the two labels mean the same thing.
| Reporting year | Rows | Filed (label as printed) | Not Submitted | Exempt | Scored rows | Avg ENERGY STAR score |
|---|---|---|---|---|---|---|
| 2014 | 243 | 243 (Submitted) | 0 | 0 | 200 | 68.1 |
| 2015 | 1,521 | 1,521 (Submitted) | 0 | 0 | 1,200 | 57.0 |
| 2016 | 2,717 | 2,717 (Submitted) | 0 | 0 | 2,300 | 60.0 |
| 2017 | 2,797 | 2,797 (Submitted) | 0 | 0 | 2,389 | 59.0 |
| 2018 | 3,430 | 2,737 (Submitted) | 420 | 273 | 2,385 | 54.8 |
| 2019 | 3,438 | 2,278 (Submitted) | 1,080 | 80 | 1,893 | 57.3 |
| 2020 | 3,582 | 2,976 (Submitted Data) | 485 | 121 | 2,527 | 59.7 |
| 2021 | 3,550 | 2,695 (Submitted) | 608 | 247 | 2,241 | 60.5 |
| 2022 | 3,613 | 2,645 (Submitted Data) | 732 | 236 | 2,251 | 60.0 |
| 2023 | 3,438 | 2,584 (Submitted) | 542 | 0 | 2,251 | 58.8 |
Of the 3,126 rows in the 2023 vintage that the file marks either filed or not — leaving aside the 312 “Not Covered 2024” rows — 82.7 percent submitted. The worst filing year in the file is 2019, with 1,080 rows marked Not Submitted. And the roster itself churns: 208 of the 3,852 buildings appear in all ten vintages, while 158 appear exactly once.
The placard wall: 769 four-stars, 564 zeros
Since 2018 the file has carried the Chicago Energy Rating — recorded on a zero-to-four scale in half steps — the number on the placard the ordinance puts at the door. The 2023 wall, counted straight from the file:
| Chicago Energy Rating, 2023 | Buildings |
|---|---|
| 0 | 564 |
| 1 | 432 |
| 1.5 | 156 |
| 2 | 292 |
| 2.5 | 229 |
| 3 | 317 |
| 3.5 | 326 |
| 4 | 769 |
Read the ends of that table together: more buildings wear the top rating than any other — 769 — and the second-largest group, 564, wears zero. The middle is thinner than either end. The ENERGY STAR side of the file says the same thing in finer print: among the 2,251 scored rows of 2023, 270 score 90 or better, 291 score under 25, and exactly one — a multifamily building the file names Sentral Michigan Avenue (ss009) — records a perfect 100.
Schools score 25 points below offices
What kind of building is on this report card? Mostly homes and schools. The 2023 vintage by the file’s own property types, with the average ENERGY STAR score of the rows that carry one:
| Primary property type, 2023 | Rows | Scored rows | Avg score |
|---|---|---|---|
| Multifamily Housing | 1,355 | 1,320 | 61.4 |
| K-12 School | 528 | 351 | 43.8 |
| Office | 365 | 304 | 69.1 |
| Residential | 327 | 0 | — |
| Commercial | 133 | 0 | — |
| College/University | 87 | 0 | — |
| Hotel | 81 | 73 | 53.1 |
The gap worth staring at: the average scored K-12 school posts 43.8, the average scored office 69.1 — 25.3 points apart on the same 1-to-100 scale. The file records scores, not reasons, and a school and an office tower are scored against different peer groups — so this page notes the gap and leaves its cause where the file leaves it: unrecorded. Is the school gap a Chicago story or a national one? This file alone cannot say; the question stays open.
The biggest and the oldest rows
The single largest reporter in the 2023 vintage is filed under the name of the Metropolitan Pier and Exposition Authority — a separate municipal authority, not a city department, and the file spells it “METROPOLITIAN PIER AND EXPOSITION AUTHORITY” — at 9,245,333 square feet, rated 2, built 1971. Behind it: the Cook County Department of Corrections Campus (county, not city; 4,570,176 square feet, built 1926), Willis Tower — filed as “Willis Tower (Rivion LLC)” — at 4,534,594 square feet with an ENERGY STAR score of 32 and a rating of 1.5, and Rush University Medical Center at 4,232,186 square feet, scoring 36. The city’s tallest building, by its own report card, scores 32 of 100.
At the other end of the age column: 86 rows in the 2023 vintage record a building built before 1900. The oldest recorded year-built is 1865 — a school building filed as “Acero Schools – Cruz – Rogers Park”, scoring 68 — followed by two 1872 buildings that split the scale: “101 Grand” scores 38 and “State Lake LLC” scores 3, while the 1873 row filed as “congress plaza hotel” (lower case as the file has it) scores 76. Can a 19th-century building outscore a 20th-century one? In this file, routinely: the 1865 schoolhouse’s 68 beats Willis Tower’s 32 by 36 points. Year built is a column here, not a verdict.
Where the covered buildings stand, and what they add up to
Three community areas hold 1,211 of the 2023 vintage’s 3,438 rows — Near North Side (544), the Loop (361) and Near West Side (306), or 35.2 percent of the file in 3 of the city’s 77 areas. And the rows that filed add up: the 2,584 submitted buildings of 2023 report 637,471,412 square feet and 4,587,800.3 metric tons of greenhouse gas — our division, labeled as ours: about 7.2 kilograms of reported CO₂-equivalent per square foot per year across the whole filing population.
- Source: the city’s Chicago Energy Benchmarking file (xq83-jr8c): 28,329 rows, one per building per reporting year, data years 2014 through 2023, 3,852 distinct building IDs; retrieved August 25, 2026. All figures were computed on the city’s portal; no row-level file was downloaded.
- Freshness: the portal shows the file’s rows last updated February 5, 2025, and 2023 is the newest reporting year present. Every figure on this page is a reading of that file as retrieved, not a statement about buildings today.
- Grain and labels: counts are of rows within one reporting year, never summed across years; reporting-status and property-type labels are counted exactly as printed, including the “Submitted” / “Submitted Data” label split and the separate “Multifamily Housing” and “Residential” types. The 2023 filing share’s denominator is the 3,126 rows marked Submitted or Not Submitted; the 312 rows labeled “Not Covered 2024” sit outside it.
- Scores and ratings: the ENERGY STAR score and the Chicago Energy Rating are reported as recorded; averages are of rows that carry a value, and rows with blanks are counted apart (353 unrated 2023 rows, all flagged exempt from the rating). The covered population changed as the ordinance phased in, so no trend is drawn from year-to-year movement in the average score.
- Names: property names are building or business names as the file spells them, quoted verbatim including case and misspellings. The Metropolitan Pier and Exposition Authority and Cook County are separate governments, named as themselves. No person appears in the file or on this page.
Computed by KCM Desk from the city’s energy-benchmarking records, retrieved August 25, 2026. Human-guided and edited — about this desk. If you spot an error, corrections come first.
Related Keep Chicagoland Moving coverage
- Does Chicago’s Alt-Fuel File Mean a Plug Is Always Near? 350 Public Electric Stations, Just 291 Fast Ports — and the Columns That Decide
- How Chicago Works, by the Numbers
- Chicago Has 412 Individual Landmarks. More Than Half Were Designated Under One Mayor.
- After the Wrecking Ball: A Rebuild Permit Follows at 84 Percent of Logan Square’s Demolished Sites, and at None of West Pullman’s 137
- Did You Know? Chicago, by Its Own Records