
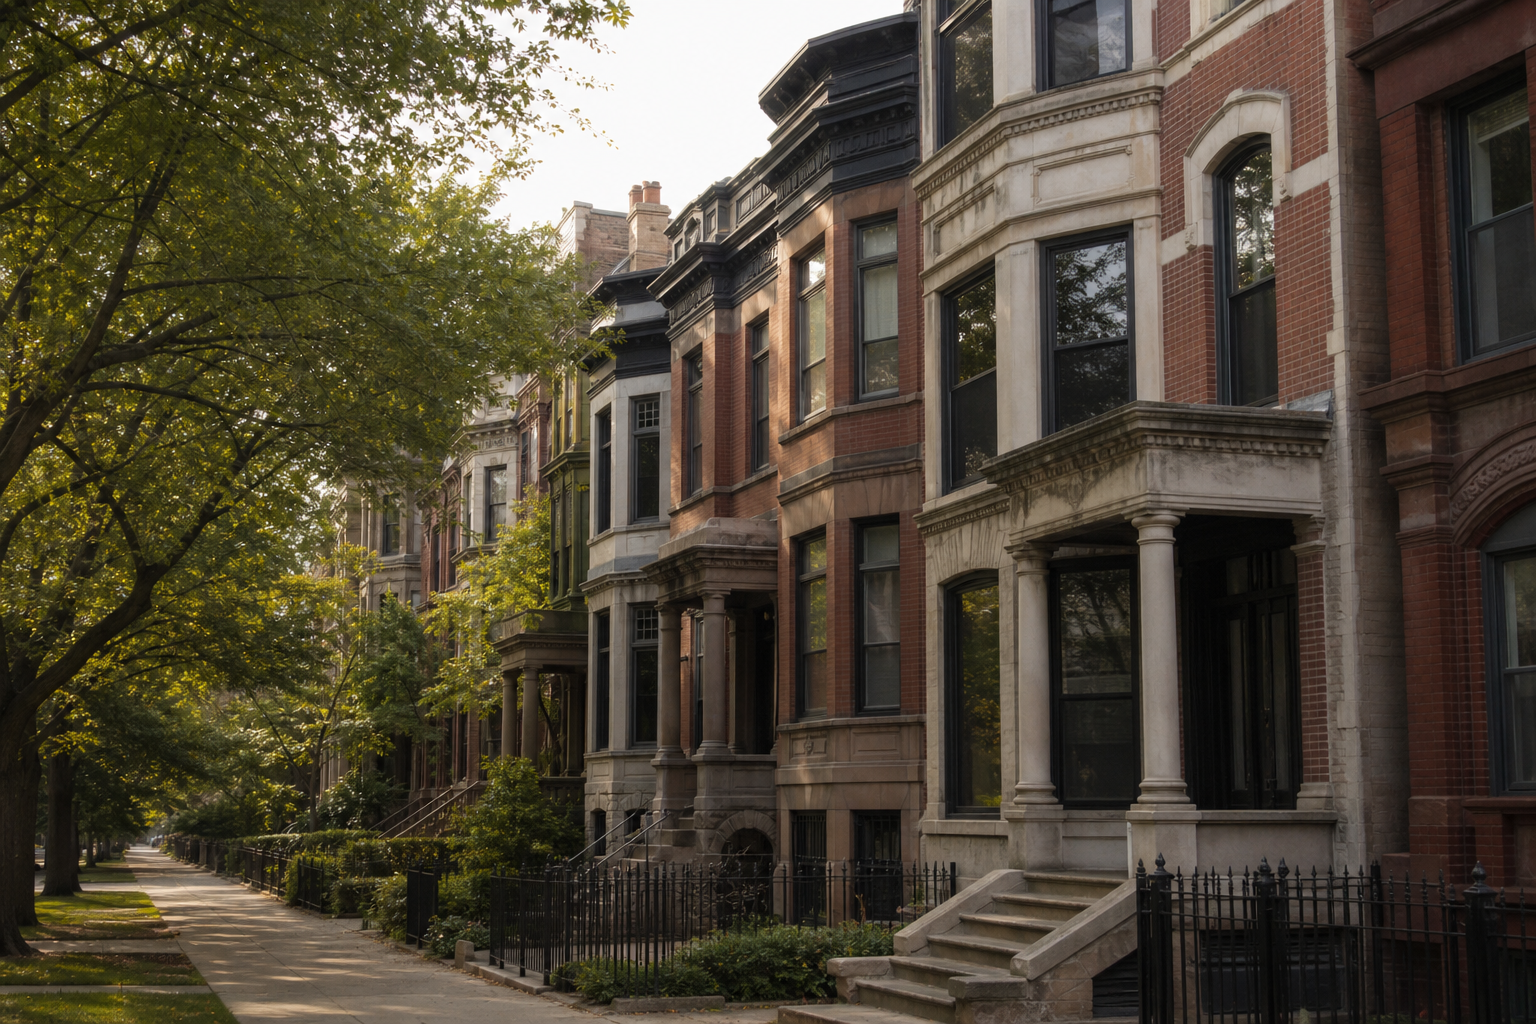

Lincoln Park holds 1,590 of the properties Chicago’s historic survey rated red or orange — 17.2 percent of the 9,267 placed in a community area, about one in six. Those two ratings are what bring a building under the Demolition-Delay Ordinance, unless it is a designated Chicago Landmark or sits in a landmark district, and the file lists 9,282 of them across 73 of the city’s 77 community areas. Four community areas — Burnside, Calumet Heights, Mount Greenwood and Riverdale — have none.
Chicago Historic Resources Survey — Red and Orange Buildings (2u8t-236p), 9,298 rows, retrieved September 16, 2026; the file was last updated August 21, 2026 · ratings are the survey’s, from fieldwork that ran from 1983 until the survey was completed in 1995 · community areas assigned here by placing each row’s coordinates inside the city’s own community-area boundaries · no address, building name or coordinate is published · the file’s demolished flag is reported with its own warning that later demolitions may still appear · no building or owner is judgedWhat red and orange mean
The Chicago Historic Resources Survey set out to rate every building, object, structure and site built in the city before 1940, and its file says surveyors found about 9,900 properties of some historic or architectural importance. Red and orange are its two highest ratings. The file is careful about what follows from them: buildings rated red or orange are subject to the Demolition-Delay Ordinance the City Council adopted in 2003, “unless designated as a Chicago Landmark or located within a Chicago Landmark District,” which fall outside the rule. Of the file’s 9,298 rows, 9,130 are orange and 152 red; the other 16 are the “few exceptions” its description mentions, rated yellow, green or blue, with one carrying no color at all.
Where the rated properties are
| Community area | Red- and orange-rated rows | Share of the placed total |
|---|---|---|
| Lincoln Park | 1,590 | 17.2% |
| West Town | 801 | 8.6% |
| Near North Side | 624 | 6.7% |
| Lake View | 471 | 5.1% |
| Near West Side | 402 | 4.3% |
| Kenwood | 387 | 4.2% |
| Lower West Side | 367 | 4.0% |
| Pullman | 296 | 3.2% |
| Logan Square | 280 | 3.0% |
| Hyde Park | 266 | 2.9% |
| Douglas | 243 | 2.6% |
| Grand Boulevard | 235 | 2.5% |
| Beverly | 232 | 2.5% |
| East Garfield Park | 221 | 2.4% |
| Loop | 194 | 2.1% |
The rated properties are heavily concentrated. Lincoln Park’s 1,590 are nearly twice the 801 in West Town, the next community area, and the ten largest counts hold 59.2 percent of every placed red and orange property. The list is not only a North Side one: Kenwood carries 387, the Lower West Side 367 and Pullman 296, each ahead of Logan Square’s 280. At the other end, Hegewisch and O’Hare have one each, Avalon Park and Garfield Ridge two, and Burnside, Calumet Heights, Mount Greenwood and Riverdale none. A count of rated properties measures what surveyors found standing and judged significant decades ago, not how much history a place holds.
The red list sits downtown
| Community area | Red-rated rows |
|---|---|
| Loop | 50 |
| Near North Side | 30 |
| West Town | 8 |
| Near West Side | 8 |
| Douglas | 7 |
| Kenwood | 5 |
| Near South Side | 5 |
| Uptown | 4 |
Red, the higher of the two ratings, is rarer and far more concentrated than orange. The Loop holds 50 of the 151 red-rated properties the boundaries place, and the Near North Side 30 more — 80 together, 53.0 percent of the red list.
Most were built before 1900
| Decade of construction, as filed | Rows |
|---|---|
| Not dated (filed as 0) | 560 |
| 1870s | 634 |
| 1880s | 2,550 |
| 1890s | 2,382 |
| 1900s | 1,061 |
| 1910s | 794 |
| 1920s | 906 |
| 1930s | 404 |
Of the 8,738 rows with a construction decade, 5,566 — 63.7 percent — date to the 1870s, 1880s or 1890s, and the 1880s alone account for 2,550. Another 560 rows carry a decade of zero, which in this file means no decade was recorded. Six are dated to the 1940s or later, past the survey’s pre-1940 scope, and one carries the decade 1916, which is not a decade; the file does not explain them.
Designated, delayed, demolished
187 of the red and orange rows carry a Chicago Landmark designation date, which by the file’s own description takes them out of the demolition-delay rule and under landmark protection instead. That leaves at most 9,095 red and orange properties that the ordinance reaches — at most, because a building inside a Chicago Landmark District is also exempt and the file does not record district membership. The designation column itself thins out: all but two of its dates run from 1970 through 2006; the exceptions are a single 2024 entry and one dated 1899, 71 years before the next-earliest designation date in the file. And the demolished flag marks just four rows, with 13 blank, under a description that warns a red or orange building “demolished after 2008 … may still appear.” The flag is a floor, not a count.
What the file confirms, and what it cannot tell you
Confirmed, as filed: each row’s survey rating, construction decade, class, any Chicago Landmark designation date and the demolished flag, and its coordinates, which place all but 15 rows in a community area. The file does not show: which buildings sit inside a landmark district; which have been demolished since 2008; how any building has changed since surveyors rated it; or whether a demolition permit has ever been sought for one. Its description also notes that a rating given to part of a building can appear on the whole of it.
Where the record lives
The survey file and the community-area boundaries sit on the city’s data portal; the survey file was last updated August 21, 2026. The community-area figures use both files, and every other figure uses the survey file alone, all as retrieved on September 16, 2026.
The bottom line
The survey behind Chicago’s demolition-delay rule rated 9,282 properties red or orange, and they are not spread evenly: Lincoln Park holds about one in six, the ten largest community areas nearly three in five, and the Loop and Near North Side more than half of the red list. At most 9,095 of those properties fall under the delay rule once designated landmarks are set aside, and the file’s demolished flag, by its own description, cannot say how many are still standing.
Two more questions the file can answer
How many rated properties are also designated Chicago Landmarks? 187 of the red and orange rows — 90 red and 97 orange. And is every row a building? Not quite: 9,111 are filed as buildings, 45 as structures, 27 as objects, one as a site and 114 with no class, although the description says structures and objects are generally left out.
- Source: the city’s Chicago Historic Resources Survey — Red and Orange Buildings file (2u8t-236p): 9,298 rows, retrieved September 16, 2026 and read whole.
- Community areas: each row’s latitude and longitude were placed inside the city’s community-area boundaries (igwz-8jzy) by point-in-polygon. 9,283 rows fall in exactly one area, none in two, and 15 in none — counts that cover all 9,298 rows; of the 9,282 red and orange rows, 9,267 fall in one area and 15 in none.
- Columns read: rating, construction start and end years and decade, class, landmark designation date, building ID, the demolished flag and coordinates. Addresses, building names, street fields and footprints were never selected, and no coordinate is published.
- Delay coverage: red and orange rows without a designation date; an upper bound, because landmark-district membership is not in the file.
- Not here: no address, no named building, no judgment of any building or owner, and no demolition count beyond the file’s own flag.
Computed by KCM Desk from the city’s Chicago Historic Resources Survey file and community-area boundaries, retrieved September 16, 2026. Human-guided and edited — about this desk. If you spot an error, corrections come first.
Related Keep Chicagoland Moving coverage
- Chicago Housing, by the Numbers
- Half of Cook County’s Houses and Small Apartment Buildings Date From 1954 or Earlier — and 2.2 Percent From 2010 or Later, by the Assessor’s Count
- Chicago Has 412 Individual Landmarks. More Than Half Were Designated Under One Mayor.
- The Chicago Community Areas With the Most Individual Landmarks
- After the Wrecking Ball: A Rebuild Permit Follows at 84 Percent of Logan Square’s Demolished Sites, and at None of West Pullman’s 137