
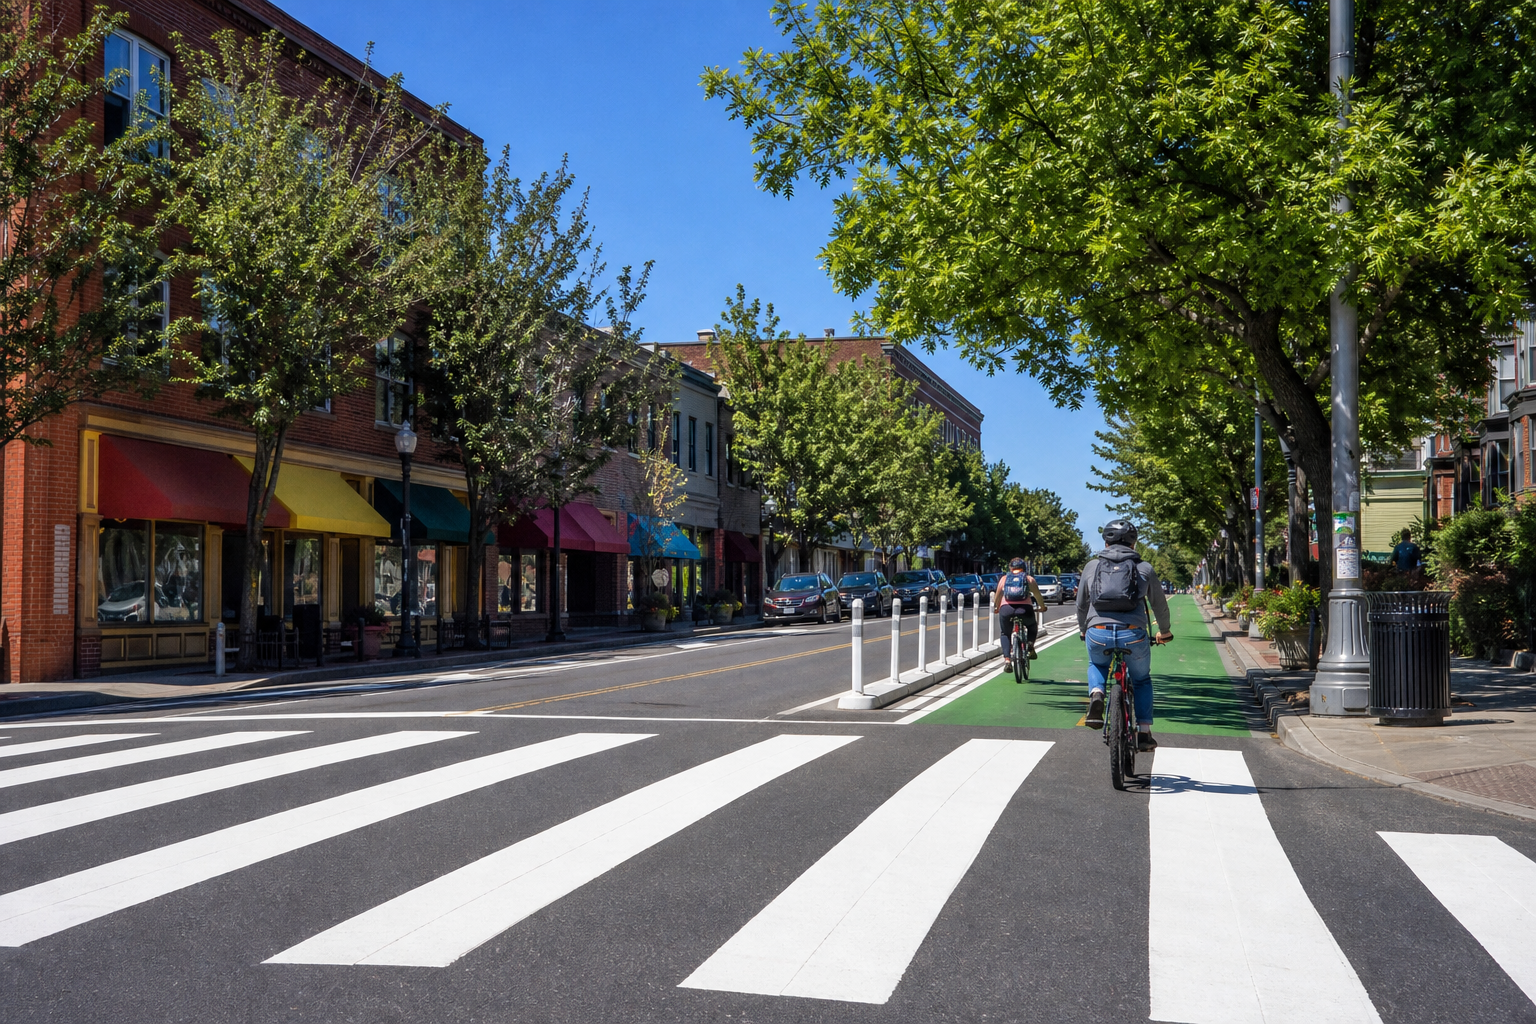

Chicago police crash reports recorded 1,710 people with an incapacitating injury in 2025 — the fewest in any full year since citywide reporting began in September 2017, and 25.1 percent below the 2,283 of 2023. The drop came among drivers, passengers and pedestrians; cyclists’ 180 incapacitating injuries were the second-most of the eight full years. This year, through August 15, the reports hold 1,008 incapacitating injuries, fewer than at that date in any earlier year, and 66 deaths, ten more than at the same point in 2025.
Traffic Crashes — People (u6pd-qa9d), 2,402,241 person records, retrieved and last updated September 16, 2026, counted with aggregate queries only · injury classes are the responding officer’s, not medical outcomes · full years are 2018 through 2025; the same-date window ends August 15 because deaths are updated for 30 days after a crash · no person’s age, location, date or other detail is published · counts are not rates · no cause is assigned to any changeEight full years, and this one so far
| Year | Incapacitating injuries | Deaths | Incapacitating injuries by Aug. 15 | Deaths by Aug. 15 |
|---|---|---|---|---|
| 2018 | 2,500 | 130 | 1,548 | 86 |
| 2019 | 2,425 | 115 | 1,455 | 67 |
| 2020 | 2,261 | 153 | 1,401 | 93 |
| 2021 | 2,377 | 166 | 1,470 | 85 |
| 2022 | 2,292 | 151 | 1,372 | 94 |
| 2023 | 2,283 | 152 | 1,461 | 90 |
| 2024 | 1,931 | 123 | 1,199 | 79 |
| 2025 | 1,710 | 93 | 1,046 | 56 |
| 2026 (through Sept. 16) | 1,208 | 75 | 1,008 | 66 |
Incapacitating injuries held between 2,261 and 2,500 a year from 2018 through 2023, then fell to 1,931 in 2024 and 1,710 in 2025, 31.6 percent below 2018. The same-date columns point the same way for injuries: 1,008 by August 15 this year against 1,046 at that point in 2025 and 1,461 in 2023. Deaths do not: 2026’s 66 by August 15 are ten more than 2025’s 56, though fewer than in any year from 2018 through 2024. The reports record when and how badly people were hurt; they do not record why a year changed.
Who was hurt
| Person type, as filed | 2018 | 2019 | 2020 | 2021 | 2022 | 2023 | 2024 | 2025 | 2026 so far |
|---|---|---|---|---|---|---|---|---|---|
| Driver | 1,209 | 1,127 | 1,174 | 1,220 | 1,153 | 1,115 | 882 | 805 | 557 |
| Passenger | 541 | 552 | 527 | 509 | 471 | 498 | 408 | 342 | 224 |
| Pedestrian | 576 | 565 | 413 | 499 | 474 | 484 | 451 | 371 | 249 |
| Bicycle | 172 | 179 | 142 | 145 | 184 | 178 | 175 | 180 | 165 |
| Non-motor vehicle | 2 | 2 | 5 | 4 | 10 | 7 | 15 | 12 | 13 |
| Non-contact vehicle | 0 | 0 | 0 | 0 | 0 | 1 | 0 | 0 | 0 |
From 2023 to 2025, incapacitating injuries fell among drivers from 1,115 to 805, among passengers from 498 to 342 and among pedestrians from 484 to 371. Among cyclists they did not fall: 178, 175 and 180, in a range of 142 to 184 across the eight years. Pedestrians make up 1.2 percent of all the person records in the file, nine in ten of which record no indication of injury, but they were 371 of 2025’s 1,710 incapacitating injuries, 21.7 percent, and 33 of its 93 deaths, 35.5 percent. Our reading: the recent decline shows up among people in vehicles and on foot, and not among people on bikes.
Three city files, three death counts
| Year | People file: deaths | Crash file: fatal injuries | Vision Zero list: deaths |
|---|---|---|---|
| 2019 | 115 | 108 | 120 |
| 2020 | 153 | 146 | 153 |
| 2021 | 166 | 165 | 186 |
| 2022 | 151 | 150 | 160 |
| 2023 | 152 | 151 | 136 |
| 2024 | 123 | 123 | 130 |
| 2025 | 93 | 93 | 101 |
| 2019–2025 | 953 | 936 | 986 |
The people file and the crash-level file are linked records of the same police reports, and they agree to within seven deaths in every year from 2019 through 2025, exactly in 2024 and 2025; their incapacitating injury counts differ by at most 58, in 2023. The city’s Vision Zero fatality list, which the Chicago Department of Transportation compiles with its own definition, counts more deaths than the people file in five of those seven years, the same number in 2020 and fewer in 2023. The list’s own description says its deaths may differ from the fatal crashes in the full crash file.
What the reports confirm, and what they cannot tell you
Confirmed, as filed: each person’s injury classification and person type, as the responding police officer reported them, with deaths updated for up to 30 days after a crash. Not shown here or not in the file: the medical outcome of any injury; rates, because the file holds no traffic volumes or population; the cause of any crash or of any year’s change; and anything that could identify a person, which this page did not select. Most person records describe people who were not hurt — 213,416 in 2025 carry “No indication of injury” — and 825 records across the file carry no classification at all.
Where the record lives
The Traffic Crashes — People and Traffic Crashes — Crashes files sit on the city’s data portal and were last updated September 16, 2026. The injury and death counts here were computed from them as retrieved that day, and the Vision Zero counts from the city’s fatality list, read the same day.
The bottom line
Police crash reports recorded 1,710 incapacitating injuries in Chicago in 2025, the fewest of any full year of citywide records and a quarter below 2023, and 2026 is lower again at the same date. The drop is among drivers, passengers and pedestrians, not cyclists. Deaths in the same reports are ten ahead of last year’s pace by August 15.
Three questions the reports can answer
How many people recorded as under 16 were killed or incapacitated from 2018 through 2025? The reports record 40 deaths and 1,028 incapacitating injuries at those ages. That is a floor, not a full count of children: another 164 deaths and 1,293 injuries carry no age, so the file cannot say how many of them were children. How many cyclists died in 2025? Two in the people file. Which road user had the most incapacitating injuries in 2025? Drivers, 805, followed by pedestrians with 371.
- Sources: the city’s Traffic Crashes — People file (u6pd-qa9d, 2,402,241 records) and Traffic Crashes — Crashes file (85ca-t3if), retrieved September 16, 2026, and the city’s Traffic Crashes — Vision Zero Chicago Traffic Fatalities list (gzaz-isa6), retrieved the same day for this desk’s Vision Zero analysis.
- Queries: every figure comes from grouped counts by year, injury classification, person type or age; no person-level record was downloaded, and identifiers, residence, license, hospital, EMS and blood-alcohol fields were never selected.
- Years: full years 2018 through 2025, because the crash file’s description says citywide data are not available until September 2017. Same-date counts run January 1 through August 15 each year, a month before retrieval, because the people file’s description says deaths are updated up to 30 days after a crash.
- Ages: grouped into bands for 2018 through 2025 combined; no age band is shown by year or by person.
- Not here: no rate, no cause for any change, no detail of any person or crash, and no advice.
Computed by KCM Desk from the city’s Traffic Crashes — People and Crashes files and its Vision Zero fatality list, retrieved September 16, 2026. Human-guided and edited — about this desk. If you spot an error, corrections come first.
Related Keep Chicagoland Moving coverage
- How Chicago Works, by the Numbers
- Chicago’s Vision Zero List Counts 101 Traffic Deaths in 2025, the Fewest of Any Year From 2019 Through 2025 — and 62 in 2026 Through July 29, Five More Than at That Date Last Year
- Chicago’s Crashes Peak at 3 p.m. The Odds of Dying in One Peak at 3 a.m.
- The Traffic Census Inside Chicago’s Enforcement Cameras: 2.2 Million Readings, and the Median Matched Segment Down Just 0.4 Percent in a Year