
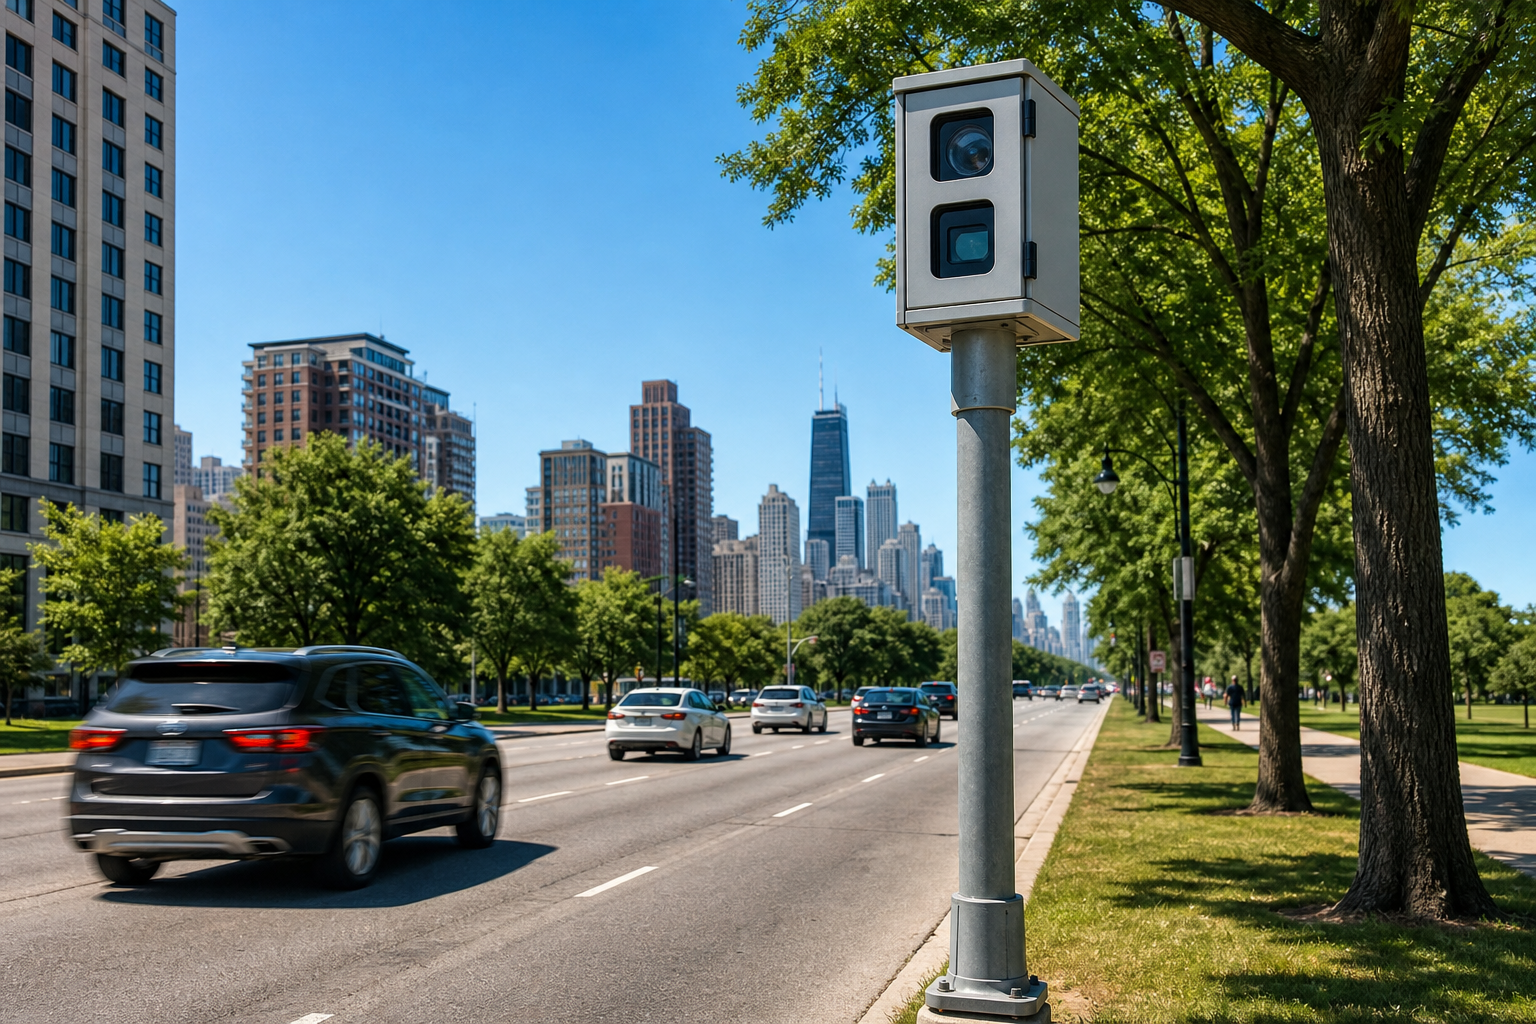

The speed-camera location recording the most violations in Chicago is 3358 S ASHLAND AVE in McKinley Park, with 151,057 recorded violations between July 1, 2025 and June 29, 2026 — about 415 a day. Our full analysis verified that address is a single camera. Across the 213 camera locations that recorded at least one violation in that window, the top ten recorded 31 percent of the 2,609,159 total. The file counts recorded violations as the city’s program defines them, and it includes violations never issued as citations — every number on this page counts recorded violations, never tickets. Here are the ten locations that recorded the most.
1. 3358 S ASHLAND AVE (McKinley Park)
The camera location at 3358 S ASHLAND AVE in McKinley Park recorded 151,057 violations between July 1, 2025 and June 29, 2026 — about 415 a day, the No. 1 location of 213 in the file. Our full analysis verified this address is a single camera, on Ashland Avenue beside McKinley Park.
2. 5857 N BROADWAY (Edgewater)
The camera location at 5857 N BROADWAY in Edgewater recorded 119,014 violations between July 1, 2025 and June 29, 2026 — about 327 a day, the No. 2 location of 213 in the file.
3. 10540 S WESTERN AVE (Beverly)
The camera location at 10540 S WESTERN AVE in Beverly recorded 88,438 violations between July 1, 2025 and June 29, 2026 — about 243 a day, the No. 3 location of 213 in the file.
4. 2740 S ARCHER AVE (Bridgeport)
The camera location at 2740 S ARCHER AVE in Bridgeport recorded 77,233 violations between July 1, 2025 and June 29, 2026 — about 212 a day, the No. 4 location of 213 in the file.
5. 2705 W IRVING PARK (Irving Park)
The camera location at 2705 W IRVING PARK in Irving Park recorded 69,216 violations between July 1, 2025 and June 29, 2026 — about 190 a day, the No. 5 location of 213 in the file.
6. 8550 S LAFAYETTE AVE (Chatham)
The camera location at 8550 S LAFAYETTE AVE in Chatham recorded 64,909 violations between July 1, 2025 and June 29, 2026 — about 178 a day, the No. 6 location of 213 in the file.
7. 445 W 127TH (West Pullman)
The camera location at 445 W 127TH in West Pullman recorded 62,484 violations between July 1, 2025 and June 29, 2026 — about 172 a day, the No. 7 location of 213 in the file.
8. 7133 N SHERIDAN RD (Rogers Park)
The camera location at 7133 N SHERIDAN RD in Rogers Park recorded 56,417 violations between July 1, 2025 and June 29, 2026 — about 155 a day, the No. 8 location of 213 in the file.
9. 2650 W PETERSON AVE / US (West Ridge)
The camera location at 2650 W PETERSON AVE / US in West Ridge recorded 55,228 violations between July 1, 2025 and June 29, 2026 — about 152 a day, the No. 9 location of 213 in the file.
10. 4909 N CICERO AVE (Albany Park)
The camera location at 4909 N CICERO AVE in Albany Park recorded 54,938 violations between July 1, 2025 and June 29, 2026 — about 151 a day, the No. 10 location of 213 in the file.
Questions these numbers can answer
Which speed camera location in Chicago records the most violations? The location at 3358 S ASHLAND AVE in McKinley Park: 151,057 recorded violations in the year through June 29, 2026, about 415 a day. These are counts of recorded violations, not a count of tickets — some recorded violations never become citations, and the file does not say which did.
How many speed cameras does Chicago have? This file shows 213 camera locations that recorded at least one violation between July 1, 2025 and June 29, 2026. That counts locations with recorded activity, and one address can hold more than one camera — it is a measure of activity, and it is never an installed-camera inventory.
How much is a Chicago speed-camera fine? Per the city program pages our full analysis read: $35 for driving 6 to 10 mph over the limit, $100 for 11 and over. Whether a recorded violation becomes a ticket with a fine is a separate step this dataset does not record.
Where these numbers come from
City of Chicago Speed Camera Violations (hhkd-xvj4), retrieved July 29, 2026: daily violation counts per camera address, summed over July 1, 2025 through June 29, 2026 — the 364 days on file in that window. The dataset states it excludes roughly the most recent two weeks and that recent figures can be revised; at our July 29 retrieval the actual gap was 30 days. Daily averages divide each location’s total by those 364 days, rounded to whole numbers. Addresses are printed as the file records them, abbreviations and one location’s “/ US” suffix included. The program history, the 2021 threshold change, and the key caveats: Chicago’s Speed Cameras Recorded 2.6 Million Violations in the Year Through June.
Computed by KCM Desk from records current to June 29, 2026. Human-guided and edited — about this desk. If you spot an error, corrections come first.