
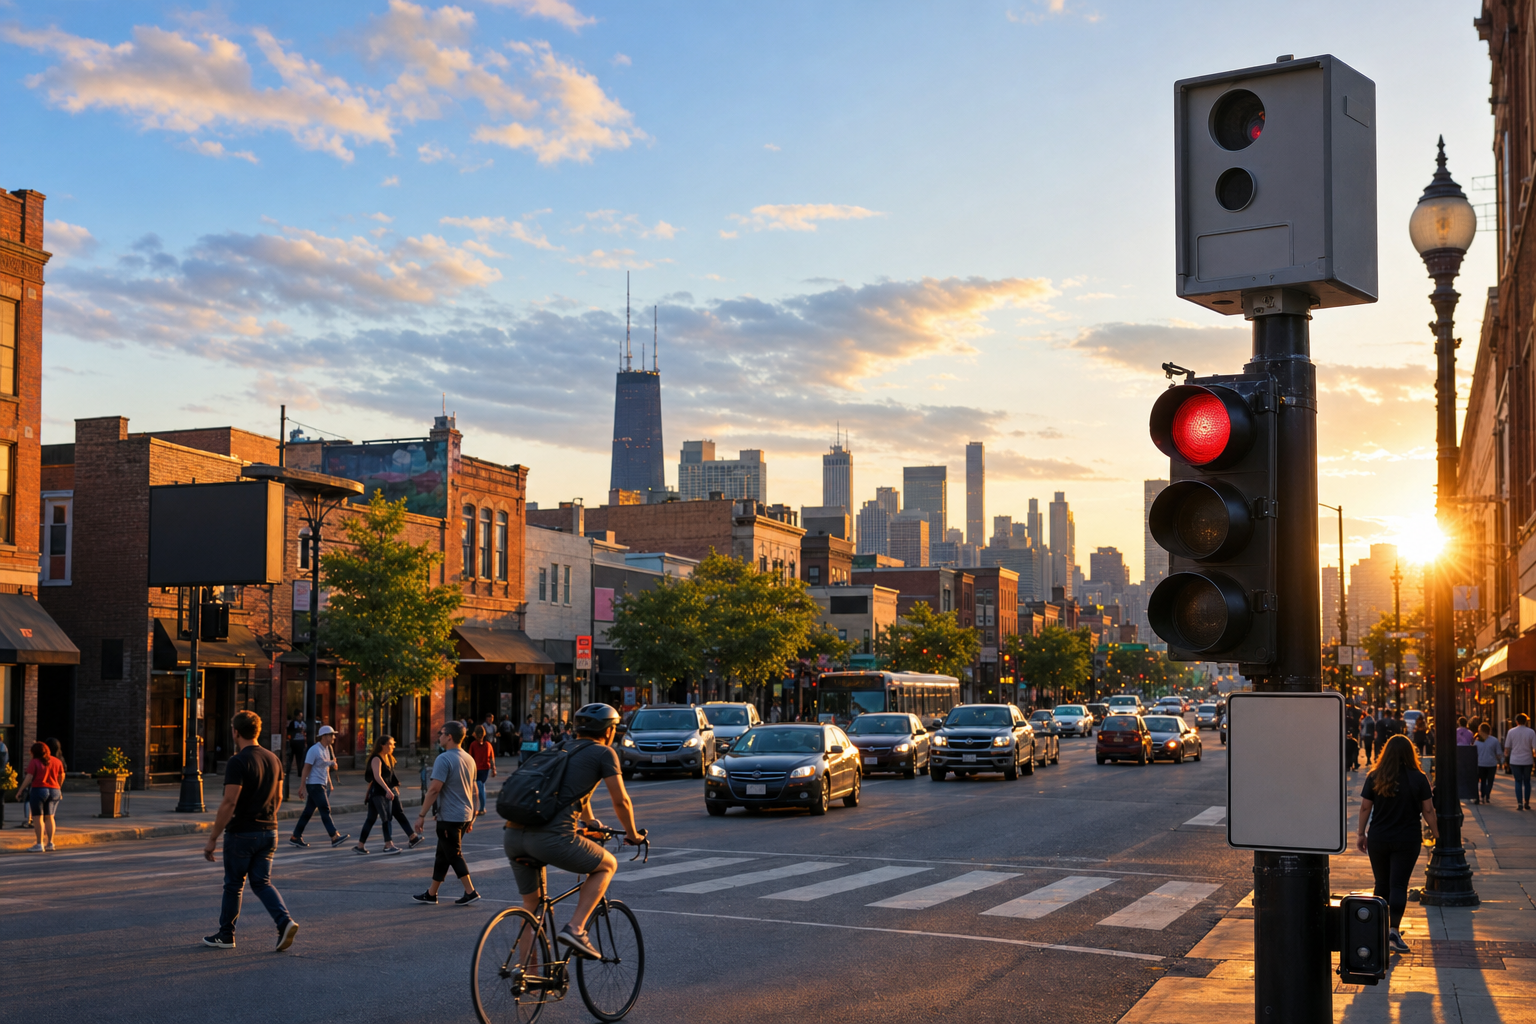

Chicago runs two automated traffic-camera programs, and they are on opposite paths. The speed cameras, which we counted this week, nearly quadrupled their recorded violations after a 2021 rule change and keep growing. The red-light cameras — the older program, at intersections since 2003 — have recorded 7.1 million violations since this file begins in mid-2014 with a fleet that has held still — 300 cameras recording in every complete year since 2018, at about 150 intersections — complete-year counts inside a 480,000-to-740,000 band, and 537,706 violations in the latest year on file — below the 2023 peak and about even with last year’s pace.
1,148,518 daily camera records summed · program history from the city’s own page, read in full · violations are camera recordings, not ticketsA red-light camera photographs vehicles that enter an intersection after the signal turns red. Chicago’s program, per the city’s program page — read in full for this piece — began in 2003 at two intersections, Peterson & Western and 55th & Western, and exists to cut the angle crashes, T-bones, that intersections produce. Most enforced intersections have cameras on two of their approaches — directions of travel, in the city’s wording. The same vocabulary rule as our speed-camera count applies here, straight from the dataset’s description: a “violation” is a camera capture reviewed by two city contractors, and the file includes violations that never became citations. Every number below is recorded violations — not tickets, not dollars.
The counts peaked in 2023 and have eased since
The file’s high-water mark is 2023, at 739,263 recorded violations. 2024 came in at 593,217 and 2025 at 534,385 — the lowest complete-year count since 2019. On matched January-through-July-15 windows — the file’s newest day is July 15 — 2026 stands at 286,028 against 282,707 last year, a +1 percent change: essentially flat. The camera fleet itself has been still: 300 distinct cameras recorded violations in every year from 2018 through 2025, after the fleet’s recorded count came down from 354 in 2014. (These are cameras appearing in the file, not an installation inventory, and the file does not say why the early counts fell.) The city’s page notes the last camera installations, removals or relocations happened in 2017.
The Lake Shore Drive–Belmont intersection leads, and the top ten take a quarter
Over the latest year on file — 2025-07-16 through 2026-07-15, exactly 365 days, 537,706 violations — the top ten of 151 enforced intersections recorded 27 percent of everything. The leader is Lake Shore Drive and Belmont in Lake View: 27,096 violations, about 74 a day from its 2 cameras. Behind it: Cicero at the I-55 ramps in Garfield Ridge (22,063), Stony Island/Cornell at 67th in South Shore (18,091), Wentworth at Garfield in Englewood (14,148), and 99th at Halsted in Washington Heights (13,211). For scale: the busiest speed-camera location recorded 415 violations a day in our companion count — the red-light counts run far lower. As with the speed cameras, the file records where violations happen, not why some intersections run hotter; road design and traffic volume are invisible to it, and this page makes no claim about causes.
- LAKE SHORE DR AND BELMONTLake View · 2 cameras27,09674
- CICERO AND I55Garfield Ridge · 2 cameras22,06360
- STONY ISLAND/CORNELL AND 67THSouth Shore · 2 cameras18,09150
- WENTWORTH AND GARFIELDEnglewood · 2 cameras14,14839
- 99TH AND HALSTEDWashington Heights · 2 cameras13,21136
- HOLLYWOOD AND SHERIDANEdgewater · 2 cameras10,12628
- CALIFORNIA AND DIVERSEYLogan Square · 3 cameras9,97327
- LAFAYETTE AND 87THChatham · 2 cameras9,96327
- STONEY ISLAND AND 76THSouth Shore · 2 cameras9,81927
- 75TH AND STATEGreater Grand Crossing · 2 cameras9,29326
How we counted
- Source: the city’s Red Light Camera Violations dataset (spqx-js37), retrieved July 29, 2026: 1,148,518 rows, one per camera per day, each carrying that day’s violation count; we summed the counts. The file runs July 1, 2014 through July 15, 2026, withholds roughly the most recent two weeks, and says recent figures can be revised.
- A violation is not a ticket: per the dataset’s description, violations are camera captures reviewed by two separate city contractors, and the file includes violations never issued as citations. Citations themselves are handled by the city’s Department of Finance and are not in this file, so this page makes no claims about tickets or revenue.
- Windows: the latest-year figures cover July 16, 2025 through July 15, 2026 — exactly 365 days ending on the file’s newest day — and per-day averages divide by 365. Year-over-year comparisons use matched January-1-through-July-15 windows.
- Units: year-by-year camera counts are distinct camera IDs; rankings group rows by the intersection name as the file records it, and each ranked entry shows how many camera IDs its figure combines — most combine two, and one combines three. Community areas come from checking coordinates against the city’s official boundary file.
- Program facts: the 2003 start, the two original intersections, the T-bone rationale, the two-approach norm and the note that cameras were last installed, removed or relocated in 2017 all come from the city’s program page, read in full. The page states 149 enforced intersections as of January 2021; this file’s latest year shows 151 intersections recording — the same scale, two counts from different dates and sources.
- What this is not: a safety analysis. Whether the cameras reduce crashes is studied elsewhere — the city’s page links a Northwestern University study — and this file cannot answer it; this is a count of what the cameras recorded.
Computed by KCM Desk from Chicago red-light camera records, July 2014 through July 15, 2026; published July 29, 2026. If you spot an error, corrections come first.
Related Keep Chicagoland Moving coverage
- Cameras Watching Chicagoland, by the Numbers
- Chicago’s Speed Cameras Recorded 2.6 Million Violations in the Year Through June. One Camera Averaged 415 a Day.
- At Least 116 Chicagoland Police Agencies Have Used Flock Plate Readers. One Suburb’s Cameras Can Be Searched by 463 Organizations.
- Riding the Red Line, 2001–2026: Every Station, One Scroll