
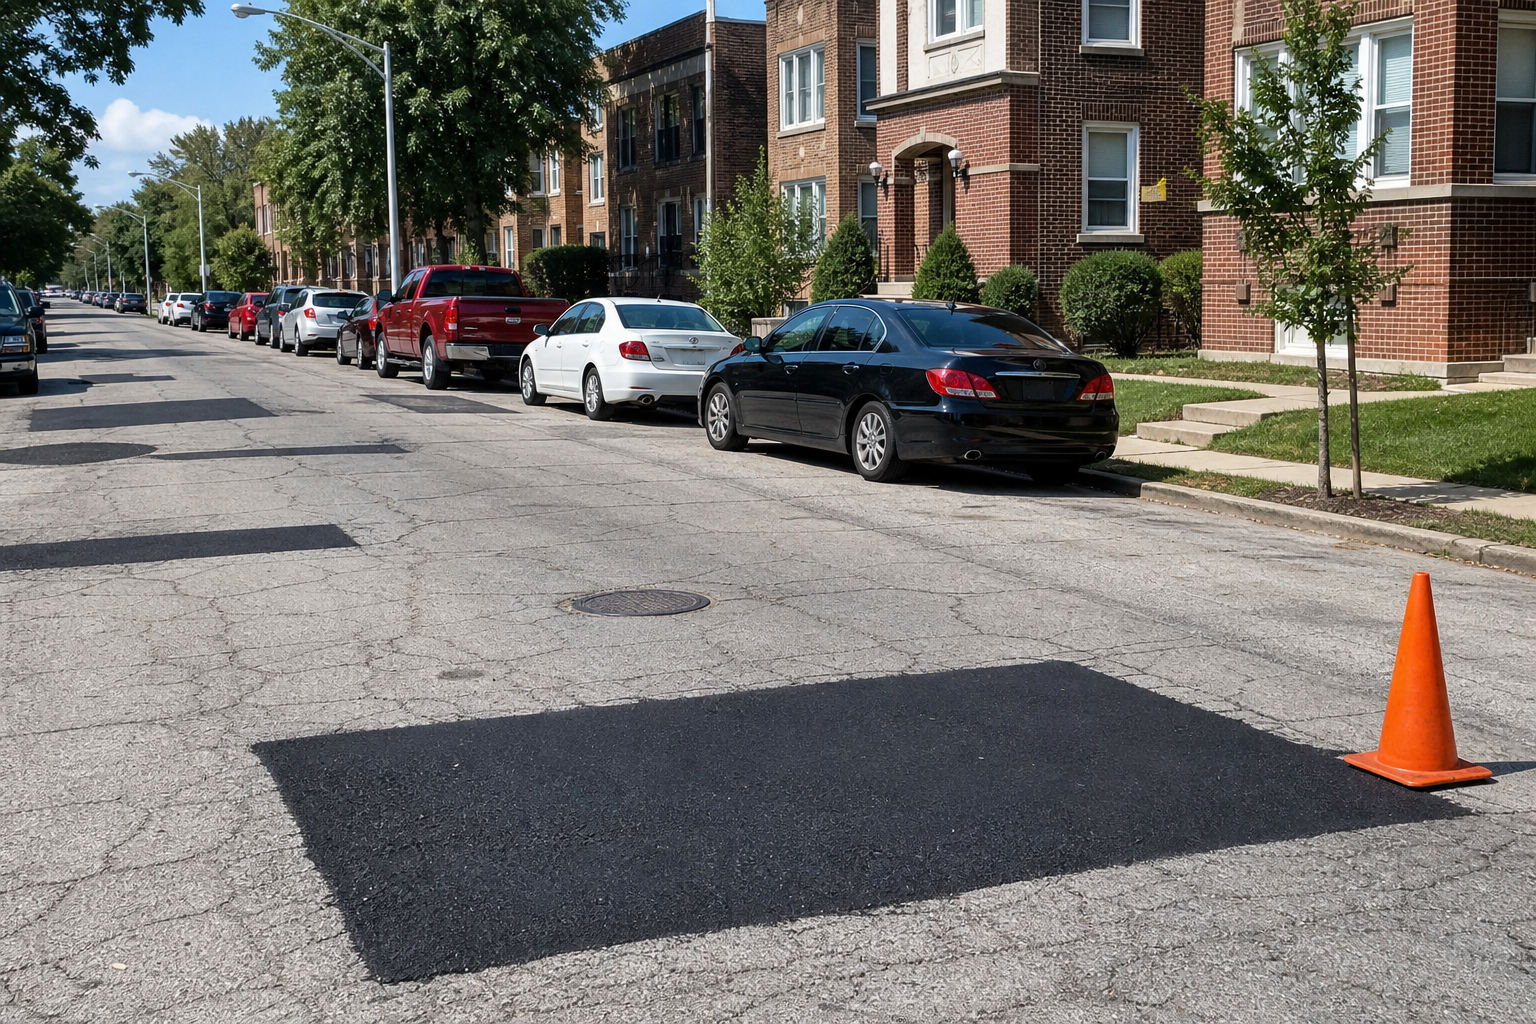

Chicago’s pothole-patch ledger — the transportation department’s own daily file of completed patch jobs — records 2,756,235 potholes filled since 2018, by the file’s own block-level counts, across 239,812 jobs. And 2026 is filling faster than last year: 247,167 potholes filled through August 17, already 6 percent more than all of 2025. The median job this year went from request to completed patch in five days. The job and pothole counts are the file’s own figures; the area map is our placement of them. And the one boundary that matters most is that this ledger records completed jobs, so the most recent months’ long-running jobs are not yet in the file.
Potholes Patched, Chicago data portal · updated daily · 239,812 rows retrieved August 18, 2026One row, one completed patch job
The file logs a row when a crew completes a patch job on a block: a request date, a completion date, coordinates, and the file’s own count of potholes filled on that block — from 1 to 467 on a single job, about eleven and a half on average computed across the whole ledger. The filled counts are summed here as the column’s own totals and nothing else. Because a row exists only once the job is done, every row carries both dates and none is pending — which also means a request made last month that will take ninety days is not in the file yet. Recent months can look faster than they will finally prove to be, and every elapsed figure below carries that caveat.
The year arc
- 201934,140 jobs470,059 filled
- 202027,726330,119
- 202126,919290,994
- 2022(the file’s peak)37,807475,475
- 202334,995366,546
- 202432,108333,453
- 2025(the quietest full year)23,733234,131
- 2026(through Aug 17)21,713247,167
The file opens with a 671-row partial year in 2018, so the arc reads from 2019: the busiest year is 2022, with 37,807 jobs filling 475,475 potholes; the quietest full year is 2025, at 23,733 jobs and 234,131 filled. Then 2026 turned: with four and a half months of the year still to go at retrieval, its 247,167 filled potholes already pass 2025’s full-year total — and its jobs are filling more potholes apiece than last year’s did, by the file’s own counts.
The patch clock
Measured on the file’s own two dates, the median job went from request to completed patch in about three days in 2020, 2021, and 2023, six and a half in 2022, about four in 2024, six in 2025, and five so far in 2026 — with the slowest tenth of 2026’s completed jobs taking 30 days or more, against 86 days in 2025. Two cautions ride those numbers. The completed-jobs boundary above cuts hardest here: 2026’s slow tail is still open, so its figures may change as long-running jobs finish and enter the file. And this clock is CDOT’s own patch intake, not the 311 clock — our 311 ranking times pothole complaints in a different file, and the two clocks are never blended here.
Where the patches went
- Near West Side8,088
- West Town7,386
- Ashburn7,058
- Near North Side6,116
- Lincoln Park5,711
Every community area’s count, in text
Near West Side 8,088; West Town 7,386; Ashburn 7,058; Near North Side 6,116; Lincoln Park 5,711; Logan Square 5,598; Austin 5,578; Norwood Park 5,557; West Ridge 5,382; Portage Park 5,353; Lake View 5,197; Belmont Cragin 4,998; Irving Park 4,928; Garfield Ridge 4,597; Auburn Gresham 4,505; Chicago Lawn 4,460; South Lawndale 4,236; Dunning 4,172; Roseland 4,134; Loop 4,123; New City 4,030; Lincoln Square 3,926; Edgewater 3,924; North Center 3,868; West Lawn 3,833; Lower West Side 3,763; Rogers Park 3,583; Morgan Park 3,518; Albany Park 3,479; Brighton Park 3,406; South Shore 3,313; Beverly 3,301; Gage Park 3,229; Jefferson Park 3,215; Clearing 3,156; West Englewood 3,141; Forest Glen 3,033; Mount Greenwood 3,013; Uptown 3,004; Bridgeport 2,932; Avondale 2,914; Washington Heights 2,853; Humboldt Park 2,834; West Pullman 2,763; Chatham 2,632; Greater Grand Crossing 2,574; Englewood 2,497; North Lawndale 2,400; South Chicago 2,378; North Park 2,153; South Deering 2,114; McKinley Park 2,089; Woodlawn 2,074; West Elsdon 2,025; Near South Side 1,900; Calumet Heights 1,804; Archer Heights 1,797; Edison Park 1,791; East Garfield Park 1,762; East Side 1,749; Hyde Park 1,747; West Garfield Park 1,449; Montclare 1,446; Hermosa 1,377; Hegewisch 1,271; Grand Boulevard 1,171; Armour Square 1,102; Pullman 1,087; Washington Park 1,076; Avalon Park 1,046; Douglas 1,001; Kenwood 847; O’Hare 841; Riverdale 760; Fuller Park 603; Burnside 411; Oakland 365.
All 77 community areas hold at least one completed patch job, and the top of the table mixes geographies: the Near West Side (8,088) and West Town (7,386) lead, with Ashburn on the Southwest Side third at 7,058. Patch-job counts measure recorded crew visits, not street condition — an area with many jobs is an area where crews completed many jobs, and the file says nothing about the potholes nobody reported.
Known limits
This is the record of work completed, not of work needed: no row exists for a pothole unpatched, unreported, or still on the docket, and recent months understate their own slow tail for exactly that reason. The filled counts are the file’s own block-level figures, summed without adjustment, and how a crew counts potholes on a block is the file’s convention, not ours. The request date is CDOT’s intake for the patch job and is not matched to any 311 complaint here. The file updates daily; every figure is a snapshot of the August 18, 2026 retrieval.
- Source Potholes Patched (wqdh-9gek, Chicago data portal), 239,812 rows at retrieval on August 18, 2026; the dataset updates daily and its rows carry request dates from March 2018 on.
- Counting One row is one completed patch job. Potholes-filled figures sum the file’s number_of_potholes_filled_on_block column as recorded. Elapsed figures measure each row’s request-to-completion span in calendar days, with medians and 90th percentiles computed per request year; no row lacked either date. Percentages are computed from raw counts.
- Geography Each job was placed by its recorded coordinates against the city’s community-area boundary polygons (Boundaries – Community Areas, igwz-8jzy, GeoJSON export retrieved August 18, 2026) by point-in-polygon with the even-odd rule; 238,547 of 239,812 place.
Computed by KCM Desk from records retrieved August 18, 2026. Human-guided and edited — about this desk. If you spot an error, corrections come first.
Related Keep Chicagoland Moving coverage
- When Does the Street Sweeper Come? Chicago’s 2026 Schedule Holds 8,545 Section-Sweep Dates, 2,721 Still Ahead — and Two Sections Booked 66 Times
- Chicago Keeps a Do-Not-Dig List: 14,093 Active Street Moratoriums, Doubled Permit Fees After Repaving — and One Stretch Protected Until 2207
- How Chicago Works, by the Numbers
- The Chicago Community Areas With the Most Pothole Patch Jobs Since 2018
- Chicago’s Big 311 Request Types, Ranked by How Fast the City Closes Them
- Chicago’s Transportation-Permit File Holds 1.8 Million Applications. More Than Half Are Marked Open.