
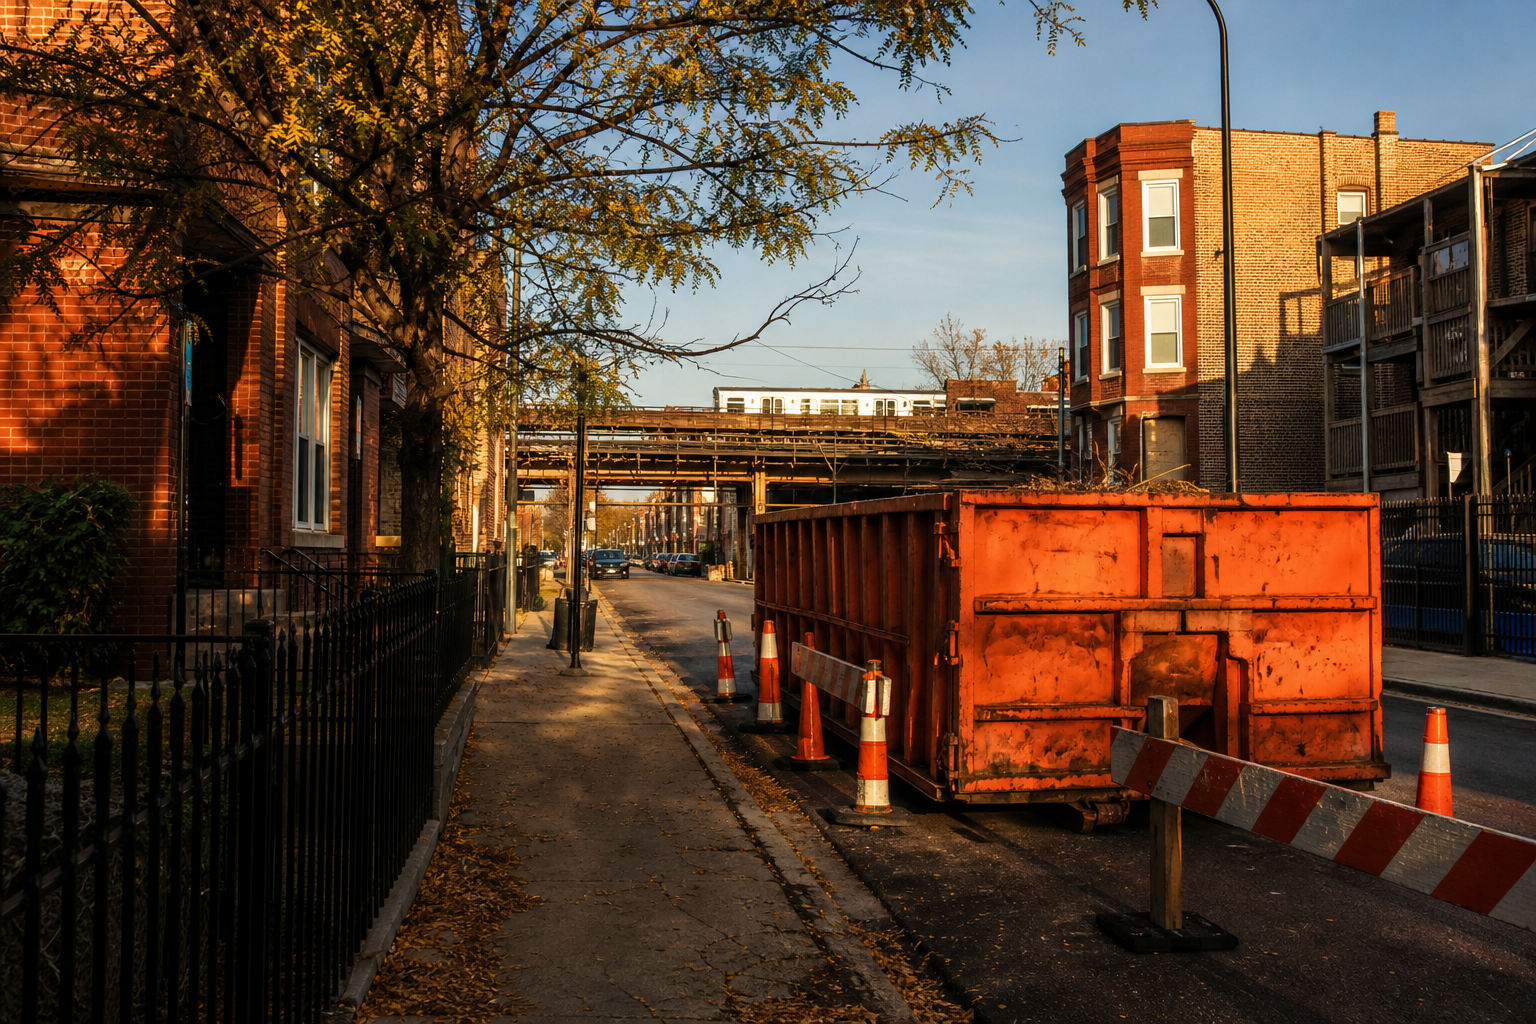

More than half of the 1.8 million permit applications in Chicago’s transportation-permit file — 985,144 of 1,801,871 — are marked Open, and the pile is not made of new paperwork: 88,142 applications with 2016 start dates, 62 percent of that year, still carry Open status roughly a decade on. The file’s applications span eleven permit types: 778,489 for public-way openings, 335,544 to occupy the right of way, 294,443 for dumpsters, 133,881 for truck routings, 97,006 for special events. Its dense years begin in 2013, peak in 2016 at 143,170 applications, and land at 102,963 in 2025 — 28 percent below the peak.
Transportation Department Permits, Chicago data portal · updated daily · 2,300,109 rows retrieved August 16, 2026One file, two counts
The file describes itself as applications to the Chicago Department of Transportation for permits “to block or otherwise affect public streets in some way” — and its portal description adds that it “also serves as a list of permits granted.” The granted permits are a subset, not the file: its milestone column also records 76,446 cancelled applications and 11,979 denied ones, so this page reads each row as what it is — an application, with its recorded status. The rows need the same care. The file’s 2,300,109 rows are not 2.3 million applications: they hold 1,801,871 distinct application numbers — 498,238 rows repeat an application already in the file, and one application carries as many as 96 rows, identical on every column this analysis reads. Our filming-permits analysis hit the same trap in its own file, where location rows quadrupled the fee sums. So one rule governs everything below: every figure on this page counts distinct applications, never rows.
What the city is asked to permit
- Public way openings778,489
- Occupy the public right of way335,544
- Dumpster permits294,443
- Truck routing permits133,881
- Special event permits97,006
Eleven permit types partition the file exactly. Behind the five above sit 56,203 periodic-process records, 45,389 address certificates, 26,046 construction canopies, 19,291 driveway installations, 12,427 private-benefit sign requests, and 3,152 miscellaneous permits — together the eleven sum to the file’s 1,801,871 applications with nothing left over. The type names are the file’s own, spelled out from its abbreviations: it renders the second-largest “Occupy the Pub. ROW Permit.”
The calendar, and its noise
- 2013(first dense year)122,943
- 2016(the file’s peak)143,170
- 2020114,155
- 2025102,963
- 2026(through the August 16 retrieval)70,319
Every year from 2013 through 2025 logs six figures of applications; before 2013 the file thins to a few thousand a year, and the 2025 count sits 28 percent below the 2016 peak. The calendar also carries noise, reported here rather than smoothed: 54,566 applications have no start date at all; 68,678 carry dates from 1900 through 2012, of which 14,541 sit on 1996 alone — more than the rest of the 1990s combined; six carry dates before 1900, one of them in the year 1010; and thirteen are dated after 2026, one in 2112. The year figures above use the dated 2013–2026 rows and touch nothing else.
The Open pile
- Started 2013(774 of 122,943)under 1%
- Started 2015(11,622 of 134,040)9%
- Started 2016(88,142 of 143,170)62%
- Started 2019(102,560 of 138,380)74%
- Started 2025(76,991 of 102,963)75%
The file’s status column takes four values: Open on 985,144 applications, Closed on 816,680, Issued on 46, Deleted on one. Read against start dates, the Open pile has a shape. Applications with 2013 and 2014 start dates are almost all closed out — 774 and 787 remain Open. The 2015 starts stand at 9 percent. Then 2016 jumps to 62 percent, and every year since 2017 holds above two-thirds. An application started in 2026 and marked Open may simply be a permit in force; one started in 2016 and still marked Open is a fact about the record. What Open means operationally — active permit, unfinished work, or a file nobody closed — is not something the file states, and this page reports the column as recorded.
A second column records each application’s current milestone, and it points the same direction: 915,017 applications — 51 percent of the file — sit at the Inspection milestone, against 727,121 marked Complete, 76,446 Cancelled, 27,425 Non Compliant, and 11,979 Denied; the remaining 43,883 applications sit in smaller categories, none larger than the 10,739 marked Incomplete Application. Denial, in this file, is an explicit recorded outcome.
Known limits
These are applications and their recorded statuses, not street activity: nothing here says a trench was dug, a dumpster delivered, or an event held. The file carries no fee columns, so nothing on this page prices a permit. It does carry applicant contact names and addresses — columns this analysis never fetched; every query was a server-side aggregate of non-personal columns. The file updates daily, so every figure is a snapshot of the August 16, 2026 retrieval, and the undated and oddly dated applications disclosed above are excluded from the year figures but present in every whole-file count.
- Source Transportation Department Permits (pubx-yq2d, Chicago data portal), 2,300,109 rows at retrieval on August 16, 2026; the dataset updates daily.
- Counting Every figure counts distinct application numbers, computed server-side; rows that repeat an application number are counted once. Status and milestone values are the file’s own, verified unique per application. Year figures use the start-date year of dated 2013–2026 applications; undated, pre-1900, 1900–2012, and post-2026 dates are bucketed and disclosed. Percentages are computed from raw counts, not from rounded figures.
- Privacy The file’s contact-name, contact-address, and free-text comment columns were never selected in any query; this analysis reads only application numbers, types, statuses, milestones, and dates, as aggregates.
Computed by KCM Desk from records retrieved August 16, 2026. Human-guided and edited — about this desk. If you spot an error, corrections come first.
Related Keep Chicagoland Moving coverage
- How Chicago Works, by the Numbers
- Chicago Has Waived Nearly Two-Thirds of Its Calculated Filming-Permit Fees Since 2021 — $5.66 Million of $8.78 Million
- Chicago’s Parking-Meter Deal, From the Documents: More Than $1.15 Billion Up Front in 2009, $161 Million in True-Up Payments Through 2024 — and a Sale the City Council Approved 46 to 3, on Conditions
- In 90 Days, Chicago Recorded 5,396 Vehicle Tows — and 4,259 Relocations
- Chicago’s 811 File Holds 14,508 Utility-Hit Reports Since 2015. Gas Leads — and 846 Reports Record What Was Hit as UNKNOWN.
- The Lowest Posted Clearance in Chicago’s Truck-Limit File Is 9 Feet 8 Inches — and One in Three Postings Sits Below 13 Feet 6