
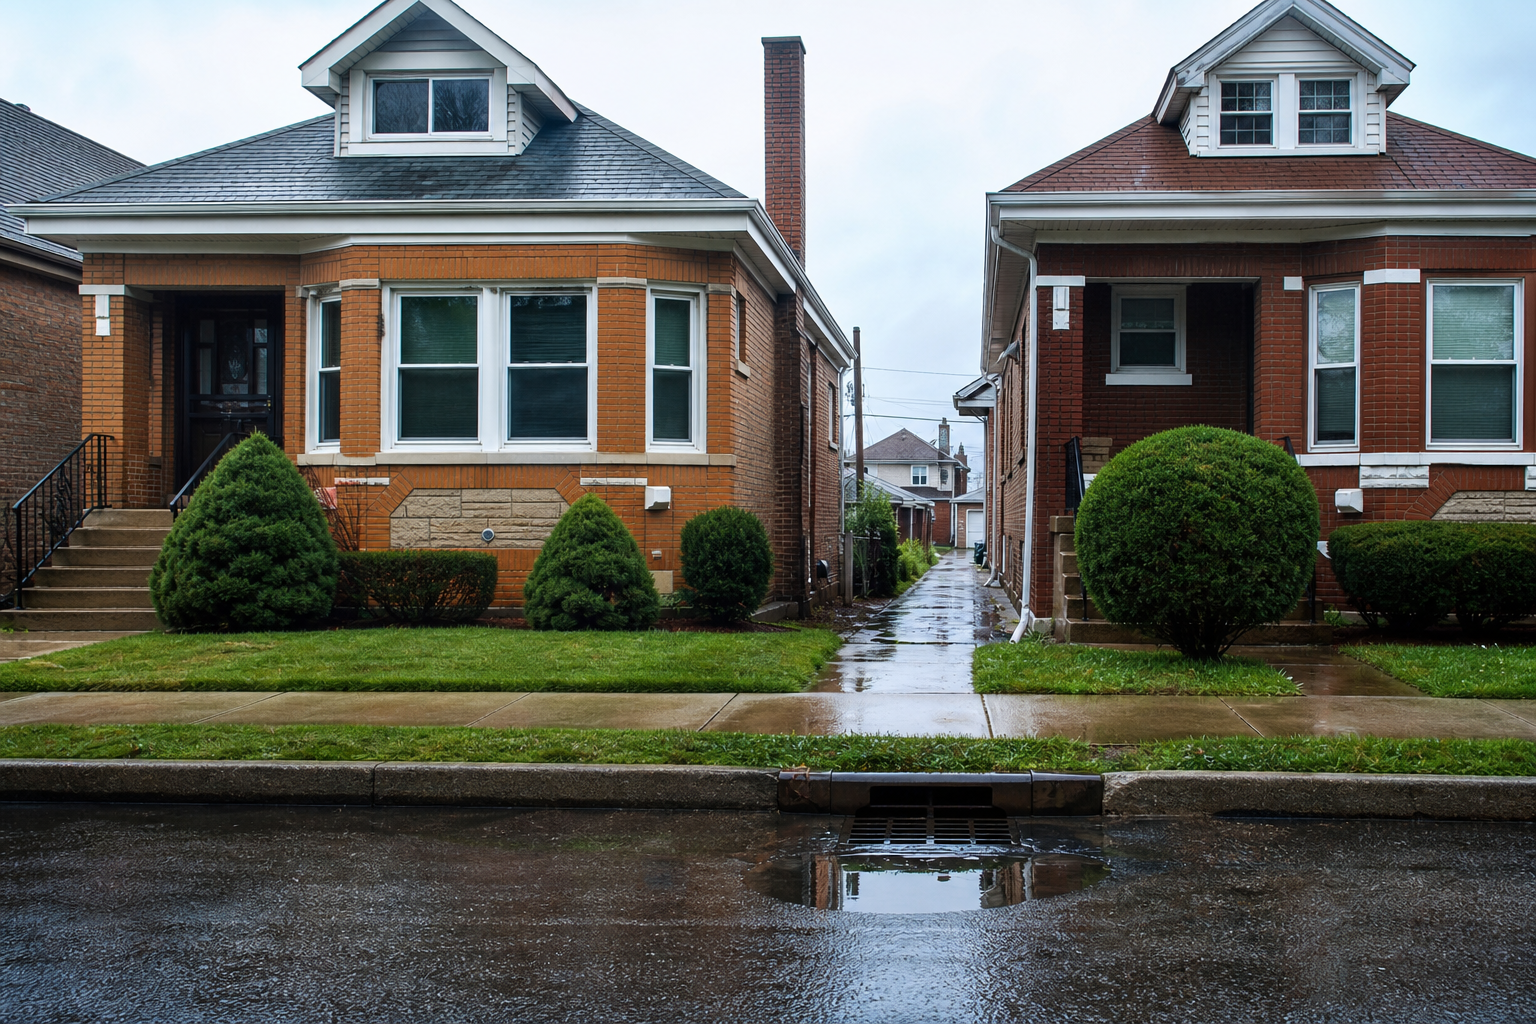

Austin has generated more water-in-basement 311 requests than any other Chicago community area since the current 311 system began recording them in December 2018 — 8,207 of the city’s 69,852, 12 percent, and 1.7 times the count of Chicago Lawn in second place. This list ranks the ten areas with the most requests of the city’s “Water in Basement Complaint” type, from our reading of the 311 file. Three rules travel with every entry. These are requests, not verified floods, and the request type, by the city’s own service-page definition, is for water backing up rather than water coming in through windows. They are counts, not rates: areas differ in how many basements they hold and in how readily residents report, and the file carries neither figure. And requests arrive with the storms — one day, August 17, 2025, holds 3,783 of them citywide — so an area’s count is shaped by whether the worst days hit it. This page takes no position on where anyone should live.
1. Austin — 8,207 requests
The West Side area leads by a wide margin: 8,207 requests, 12 percent of the citywide file and 1.7 times the next area. Austin led the 311 file’s water-in-basement count in our parent analysis as well, where it anchored the map.
2. Chicago Lawn — 4,720 requests
Second at 4,720 — 6.8 percent of the file — and the first of a cluster of Southwest Side areas that fills most of this list.
3. Gage Park — 2,748 requests
2,748 requests, third citywide and adjoining Chicago Lawn.
4. West Lawn — 2,421 requests
2,421 requests; with Chicago Lawn, Gage Park and Garfield Ridge, four of the top five sit on the Southwest Side.
5. Garfield Ridge — 2,285 requests
2,285 requests, fifth, and the fourth Southwest Side area in five entries.
6. Roseland — 2,185 requests
2,185 requests — the first Far South Side area on the list.
7. Portage Park — 2,174 requests
2,174 requests, eleven behind Roseland, and the only Northwest Side area in the ten.
8. Auburn Gresham — 1,857 requests
1,857 requests — eighth, and the first of three South Side areas that close the list.
9. Chatham — 1,714 requests
1,714 requests, ninth, adjoining Auburn Gresham.
10. West Pullman — 1,588 requests
1,588 requests, tenth — just ahead of Washington Heights at 1,555, the first area off the list.
Questions these numbers can answer
Which Chicago area has the most basement-flooding 311 requests? Austin, with 8,207 of the city’s 69,852 Water in Basement Complaint requests since December 2018 — 12 percent. The ten areas on this list together hold 29,899, 43 percent of the file; all 77 community areas appear at least once, O’Hare the fewest at 20.
Does a high count mean an area floods more? The file cannot say. It records requests — about half by phone, the rest online, through aldermanic offices and the mobile app — not verified floods, and it records no rates: how many basements an area has, and how readily its residents report, are not in the record.
Why do the counts cluster on the Southwest and Far South Sides? The file does not explain its own geography. What it shows is that requests arrive on storm days — the twenty busiest days hold a third of the file — so where the worst storms landed shapes the table, and the city’s own basement-flooding page describes the mechanism as sewer mains filling during intense storms and water pushing into basements through private drains.
Where these numbers come from
The city’s 311 Service Requests dataset (v6vf-nfxy), rows of service type Water in Basement Complaint: 69,852 retrieved August 20, 2026, created December 19, 2018 through that date. Each request is counted in the community area the file itself assigns; the parent analysis checked that column against our own placement of the file’s coordinates and the two agreed on 69,773 of 69,780 rows that had both. 53 requests carry no area and are excluded from area counts. The storm-day concentration, the year arc, the origin split, and the closing clock are in the full analysis: Chicago’s 69,852 Water-in-Basement 311 Requests Since 2018 Follow the Storms: One Day in August 2025 Holds 5 Percent of Them, and Twenty Days Hold a Third.
Computed by KCM Desk from records retrieved August 20, 2026. Human-guided and edited — about this desk. If you spot an error, corrections come first.
Related Keep Chicagoland Moving coverage
- Chicago’s 69,852 Water-in-Basement 311 Requests Since 2018 Follow the Storms: One Day in August 2025 Holds 5 Percent of Them, and Twenty Days Hold a Third — the full analysis behind this list
- How Chicago Works, by the Numbers
- Chicago’s Deep Tunnel, by MWRD’s Own Records: 1.55 Trillion Gallons Pumped Back in 28 Logged Years, $3.86 Billion in Contract Dollars — and the Last Reservoir Stage Has Slipped From 2029 to 2032