
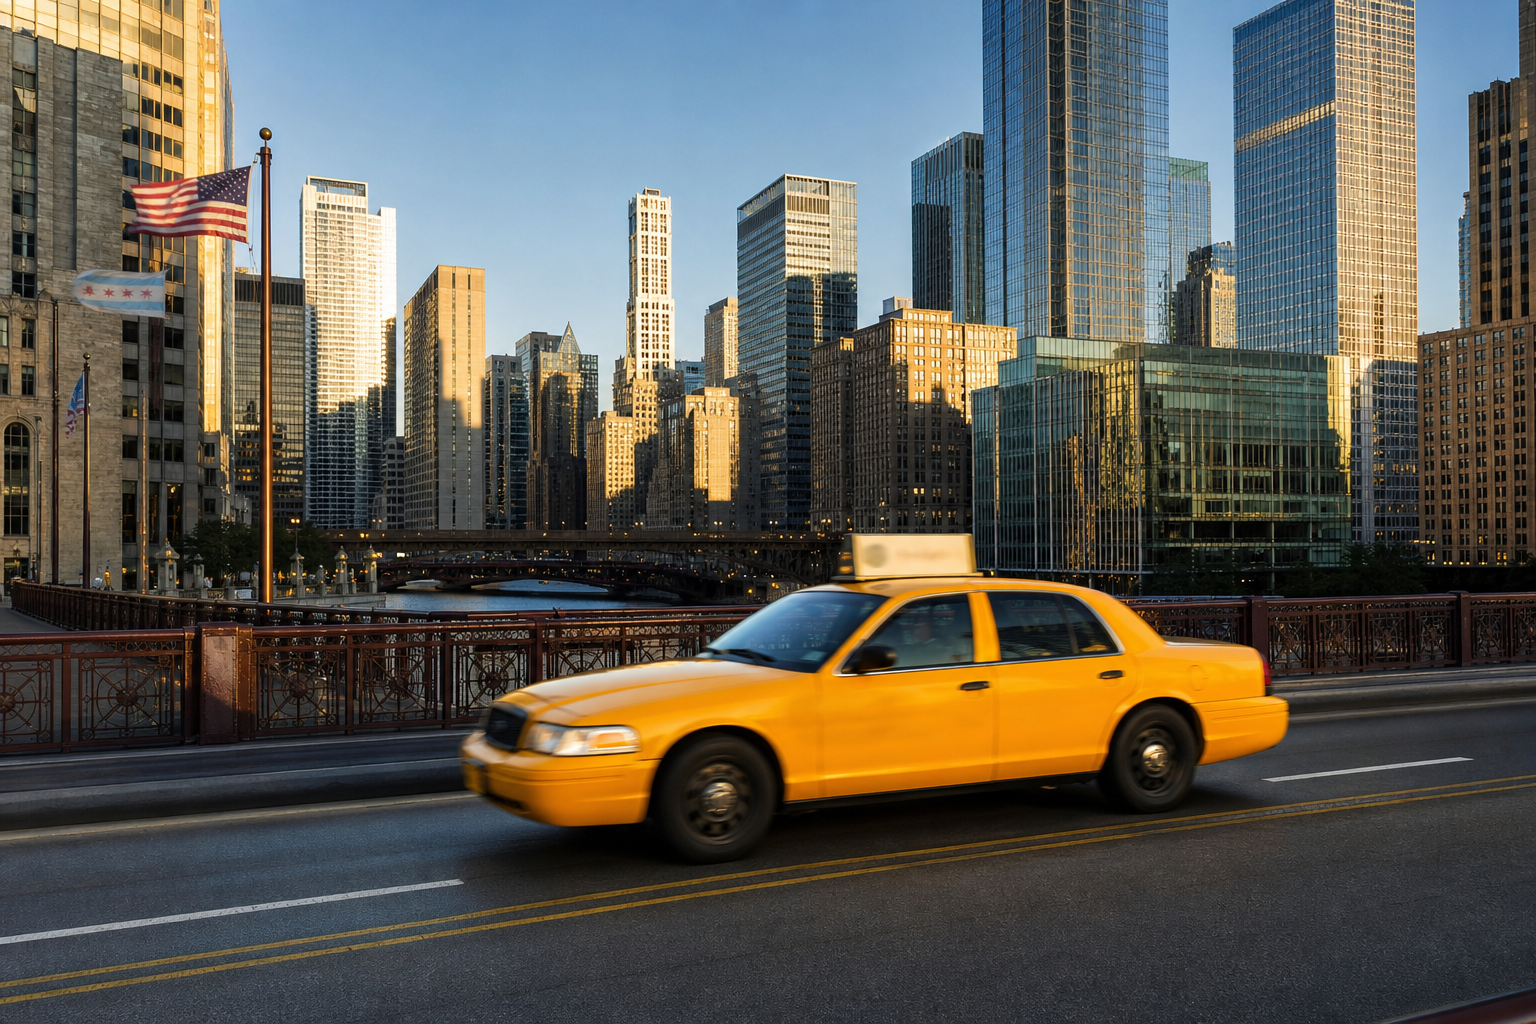

In June 2026, a mile in a Chicago taxi cost $4.17 and a mile in a rideshare cost $4.21 — 3.4 cents apart, computed from the city’s own trip files by the identical formula: the counted trips’ summed dollars divided by their summed miles, citywide, the same month — and both files count the same way, trips with recorded miles above zero and a Chicago pickup community area. By that month, the two rides had nearly converged on price. They had not converged on what makes up the price. Of the taxi’s $4.17, 81 cents of every dollar was the metered fare; of the rideshare’s $4.21, 60 cents was the fare and almost 35 cents was the additional-charges line. Around that headline, the taxi file holds its own arc: the cost of a taxi mile rose 9.3 percent between 2024 and the first seven months of 2026 while the average trip got cheaper, shorter and slower; two of the city’s 77 community areas supply a fifth of all pickups; about 2,900 cabs are doing the driving; and the file records essentially no tips on cash-paid trips — $983 across 680,800 of them so far this year.
Taxi Trips (2024 – ) (ajtu-isnz), 17,462,917 recorded trips, of which 15,672,805 carry recorded miles above zero and a Chicago pickup community area, January 1, 2024 – July 31, 2026 · retrieved August 25, 2026 · cost per mile = sum of trip totals ÷ sum of trip miles, the same formula and filter as our rideshare receipt · 2026 figures cover January–July onlyWhat a taxi mile costs, year by year
Every figure below is a citywide sum over the trips a Chicago taxi meter reported to the city: total dollars divided by total miles, with no averaging of averages and no outlier trimming. The file opens in January 2024, so the arc is short — and it still moves.
| Window | Recorded trips | Cost per mile | Fare-only per mile | Average trip total | Average trip | Average speed |
|---|---|---|---|---|---|---|
| 2024 | 5,695,311 | $3.769 | $3.046 | $28.44 | 7.55 mi | 20.1 mph |
| 2025 | 6,177,837 | $3.818 | $3.122 | $26.43 | 6.92 mi | 19.8 mph |
| 2026 (Jan–Jul) | 3,799,657 | $4.119 | $3.357 | $25.19 | 6.12 mi | 18.9 mph |
Read the cost-per-mile and average-trip-total columns together and the table looks like a contradiction: the average trip got cheaper — $28.44 in 2024, $25.19 in January–July 2026 — while the average mile got dearer, $3.769 to $4.119, a 9.3 percent rise. The arithmetic resolves it: the average recorded trip shrank from 7.55 miles to 6.12. The recorded rides are getting shorter, and each recorded mile costs more. The trips are slower, too — 20.1 miles per hour across 2024’s recorded trip time, 18.9 in 2026. Month by month, the climb steepens at the end of the window: the cheapest month in the file is January 2025 at $3.637 a mile, and the most expensive is the file’s last complete month, July 2026, at $4.605 — a level no earlier month approaches. The file records the prices, not the reason; why July 2026 stands alone is a question the trip file leaves open.
The meter and the app: same month, same math
Does the cab still cost more than the app? Chicago publishes both sides’ trip files, so the question has an answer, and for June 2026 the answer is: by 3.4 cents a mile. We computed our rideshare receipt’s citywide figure — $4.207 per mile across 6,486,420 June 2026 rideshare trips — with the same formula and the same filter this page uses, so the two numbers are built to stand next to each other.
| June 2026, citywide | Recorded trips | Cost per mile | Fare-only per mile | Fare share | Tip share | Additional-charges share |
|---|---|---|---|---|---|---|
| Taxi | 651,021 | $4.173 | $3.369 | 80.7% | 9.5% | 8.4% |
| Rideshare | 6,486,420 | $4.207 | $2.507 | 59.6% | 5.8% | 34.6% |
The totals nearly match; the way they are assembled sharply differs. The recorded components of a June taxi dollar: 81 cents metered fare, 9 cents in tips, 8 cents tolls and extras. Of a June rideshare dollar: 60 cents fare, 6 cents tip, and almost 35 cents on the published additional-charges line. (The shares are of published sums; blank components on some taxi rows and the rideshare file’s rounding mean they need not sum to exactly one dollar.) Our rideshare receipt documents that movement over time: the additional-charges share of a rideshare dollar was 18.2 cents in June 2023 and 34.6 in June 2026. Our reading of the two files, labeled as ours: the taxi’s price lives on the meter, where a rider can watch it, and the rideshare’s has moved to the lines below the fare. The taxi mile was also 9.0 percent dearer than the same month two years earlier — $3.828 in June 2024, $4.173 in June 2026 — and the rideshare mile climbed the same way in our receipt, $3.814 in June 2023 to $4.207 in June 2026. The convergence is not the app getting cheap; both prices climbed.
Two community areas, a fifth of all pickups
Is the taxi trade an airport trade? The file reports pickup locations at the community-area level, and at that level the answer is: two areas out of 77 — O’Hare, the community area named for its airport, and Garfield Ridge, the Southwest Side area that holds Midway — supplied 26.6 percent of all recorded pickups in 2024, 22.8 percent in 2025, and 20.0 percent in January–July 2026. A fifth to a quarter of the recorded pickups start in the two airport-area community areas — areas that hold more than the airports themselves — and that share has fallen for two straight years. The file records where the trips began, not why the mix is shifting — we leave the cause open.
| Window | O’Hare CA pickups | Garfield Ridge CA pickups | Share of all recorded pickups |
|---|---|---|---|
| 2024 | 1,312,470 | 200,995 | 26.6% |
| 2025 | 1,247,751 | 162,949 | 22.8% |
| 2026 (Jan–Jul) | 684,870 | 76,624 | 20.0% |
About 2,900 cabs are doing the driving
The trip file identifies each vehicle by a hashed ID — a code, not a name — and counting distinct codes gives a working-fleet floor: 3,063 distinct taxis recorded at least one trip in 2024, 3,044 in 2025, and 2,925 have so far in January–July 2026. Divide the year’s trips by its cabs and 2024’s 5,695,311 trips work out to an average of 5.1 recorded trips per cab per day — a derivation of ours, an average over cabs that drove once and cabs that drove double shifts alike. Beside it, from our medallion ledger, built on the city’s Taxi Medallion Transfers file (6u8z-aubf, retrieved August 24, 2026): that file — which runs June 2007 through August 13, 2026 — has recorded 4,221 distinct medallions changing hands, and the median recorded sale fell from $357,000 in 2013 to $6,000 across 2026’s recorded sales through August 13. The two files count different things — vehicles that drove in a year versus plates that ever traded — so the numbers sit side by side here, never merged.
How riders pay — and the tip the file cannot see
In 2024, the most common way to pay a Chicago cab was a credit card. In January–July 2026 it is the row the file calls Mobile — 1,561,475 trips, 41.1 percent of the window — with credit cards second and cash third. Cash is fading but far from gone: 25.5 percent of 2024’s recorded trips, 17.9 percent so far in 2026.
| Payment type | 2024 trips | 2025 trips | 2026 (Jan–Jul) trips | 2026 recorded tips |
|---|---|---|---|---|
| Mobile | 943,968 | 1,743,833 | 1,561,475 | $1,945,475 |
| Credit Card | 2,312,208 | 2,163,411 | 1,205,913 | $7,171,647 |
| Cash | 1,453,915 | 1,293,658 | 680,800 | $983 |
| Prcard | 744,970 | 739,212 | 269,789 | $28,056 |
Look at the cash row’s last cell. Across 680,800 cash-paid trips in January–July 2026, the file records $983.15 in tips — about a seventh of a cent per trip. The years before match: $2,261 across 1,453,915 cash trips in 2024, $1,110 across 1,293,658 in 2025. Where does a cash tip go? All but never into this file. Our reading, labeled as ours: those near-zero cash rows read to us as tips the record never received, not tips that were never given — the file cannot say which. What it can say is this: if any rider on those 680,800 trips tipped in cash, that tip is invisible here, so the taxi tip figures on this page count what the trip record holds, and whatever riders hand over in cash sits outside what this file can show.
The shape of a fare
What does the middle of the file look like? Banding the January–July 2026 trips by their recorded totals: the most common band is $10 to under $25 — 1,664,429 trips — and rides of $100 or more are 34,970 of 3.8 million, less than one percent.
| Recorded trip total | Trips, 2026 (Jan–Jul) |
|---|---|
| under $10 | 872,947 |
| $10 to under $25 | 1,664,429 |
| $25 to under $50 | 643,379 |
| $50 to under $100 | 579,843 |
| $100 or more | 34,970 |
The company names on the trips are business entities as the file records them. The six most frequent in January–July 2026: Flash Cab (781,559 trips), Taxicab Insurance Agency Llc (534,414), Transit Administrative Center Inc (470,273), Sun Taxi (446,508), City Service (420,408), and Chicago Independents (302,115). These are counts of the company-name field the file records on each trip — the file does not say what role the named company played — and this page does not compute per-company prices, which a trip mix would distort.
- Source: the city’s Taxi Trips (2024 – ) file (ajtu-isnz): every trip a Chicago taxi meter reported to the city from January 1, 2024 onward; retrieved August 25, 2026, when the file’s last trip-start timestamp read 12:00 a.m. August 1, 2026. This page’s figures stop at trips starting through 11:59 p.m. July 31, 2026; rows stamped exactly midnight August 1 are excluded. All 17,462,917 rows were aggregated on the city’s portal; no trip-level file was downloaded.
- Filter and formula: figures use the 15,672,805 trips with recorded miles above zero and a recorded Chicago pickup community area — the identical filter our rideshare receipt uses — and cost per mile is sum of trip totals ÷ sum of trip miles, with recorded meter values as published and no outlier trimming. Excluded from the whole file: 1,487,797 rows with no or zero recorded miles and 474,377 with no pickup community area (conditions overlap). Within the kept trips, 36,888 carry a $0 or blank total; they stay in the counts and add nothing to the sums.
- Components: the file publishes fare, tips, tolls and extras beside each total, but some rows carry a total with blank components, so the published components sum to slightly less than the published totals and the share columns need not close to 100 percent. Additional charges here = tolls + extras as published.
- The rideshare comparison: taxi and rideshare figures are computed by the same formula on the same filter for the same month, June 2026. One difference is the city’s own: it rounds each published rideshare fare to the nearest $2.50 and each tip to the nearest $1.00, while taxi meter values are published as reported. Over hundreds of thousands of June trips the citywide ratio absorbs that rounding, but the precision of the two files differs.
- 2026: a partial year — trips starting January 1 through July 31, 2026 — and every 2026 taxi-trip figure on this page says so. The one medallion figure on this page comes from a different file whose own dates are named where it appears.
- Privacy: the file identifies vehicles by hashed IDs and locations at the community-area level; no person appears in the file or on this page. Company names are business entities as filed.
Computed by KCM Desk from the city’s taxi and rideshare trip files, retrieved August 25, 2026. Human-guided and edited — about this desk. If you spot an error, corrections come first.
Related Keep Chicagoland Moving coverage
- The Register Behind the Weird Lines on Your Chicago Receipt: 41,940 Tax Registrations, 35 Labels — and Two Labels With One Registrant Each
- Chicago’s Chauffeur Register Holds More Expired Licenses Than Active Ones — 13,758 to 13,274 — and Its Oldest Active License Record Was Issued in 1965
- How Chicago Works, by the Numbers
- The Fare Fell. The Bill Rose. The Additional-Charges Line Now Takes More Than a Third of What Chicago Riders Pay.
- Chicago’s Taxi Medallions, Sale by Recorded Sale: A $357,000 Median in 2013, $6,000 in 2026 — and the File’s Most Frequent Seller Is the City Itself
- More of Chicago’s Taxi License Records Sit at VIOLATION Than ACTIVE — 3,518 to 2,679, in the City’s Own Register