
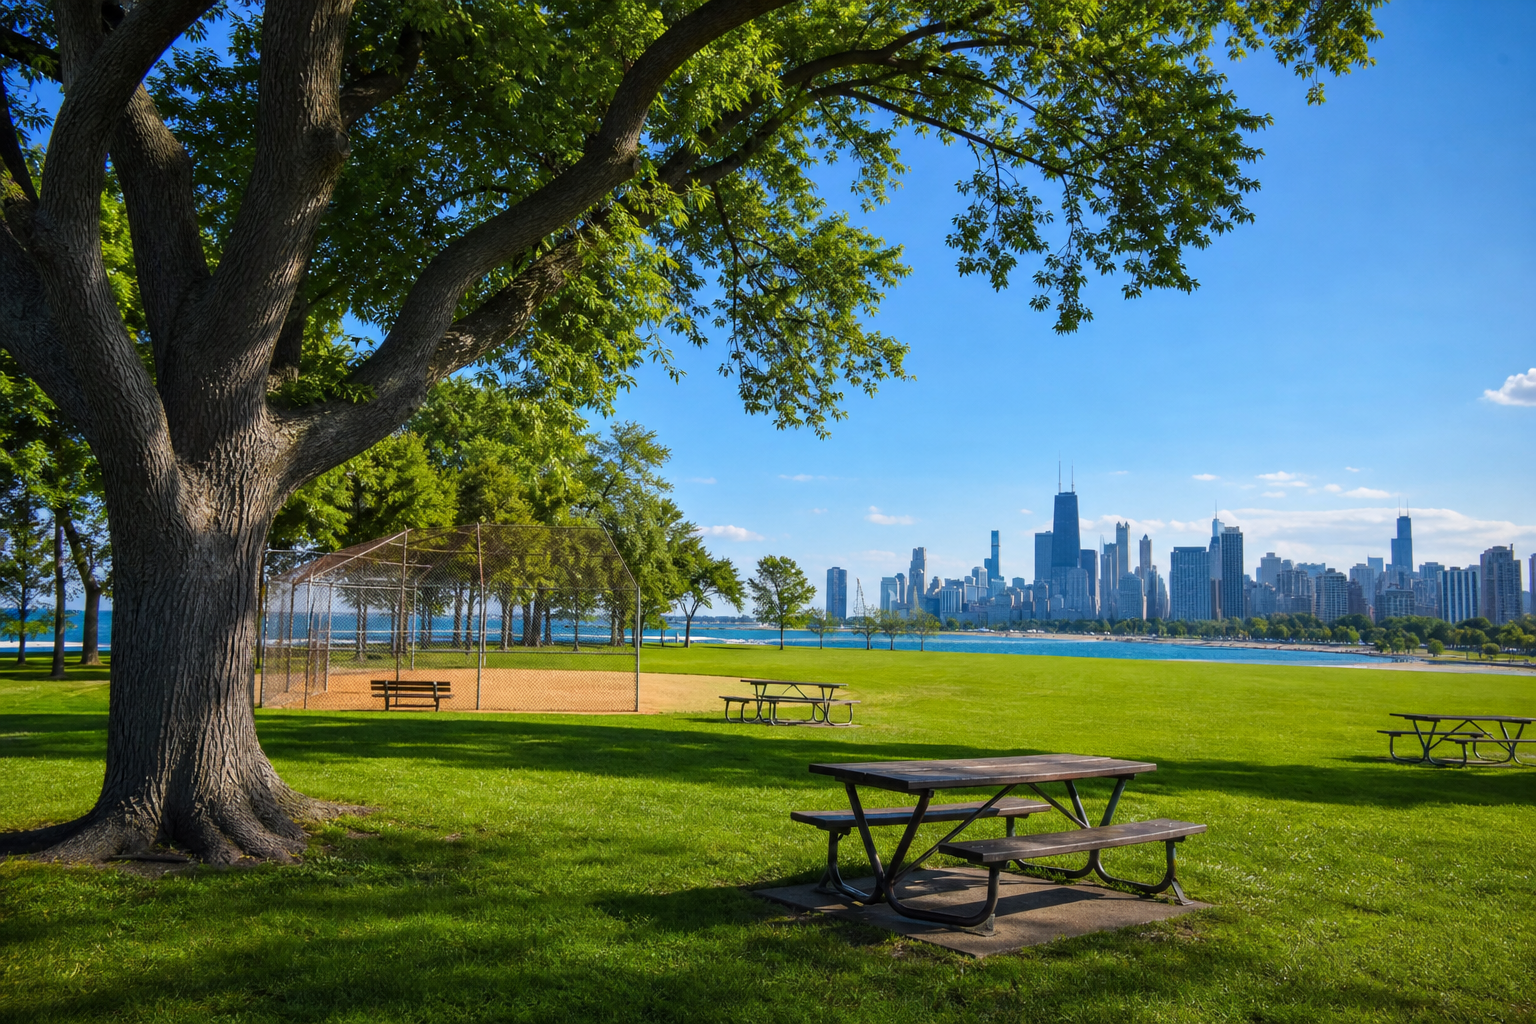

The Chicago Park District — a separate government from the City of Chicago, with its own board and budget, though this file lives on the city’s data portal — keeps a reservation ledger for its outdoor spaces: 142,366 rows dated January 2012 through bookings already on the calendar for December 31, 2026. Read by its own labels, the ledger is three calendars in one: 96,765 rows labeled as permits, 40,553 labeled “Administrative Reservation” — 32,733 of them printed as “Internal Hold” rows — and 5,048 labeled “Venue Rental,” 1,867 of them weddings. The permit calendar is a calendar of yeses: 98.0 percent of its rows are marked Approved, and the only denial-shaped label in the file, “Stage Denied,” appears 13 times in fifteen years. The most common thing on the permit calendar is not a festival — it is athletic training, one row in three. And the single most-reserved space in the file is a greenhouse: the Garfield Park Conservatory’s show rooms, 5,671 reservations and counting.
Chicago Park District – Outdoor Event Permits (pk66-w54g), 142,366 rows dated by reservation start, January 7, 2012 – December 31, 2026 · retrieved August 25, 2026 · the requestor and organization columns were never selected — no applicant name was queried · event-type labels counted exactly as printed, in three lanesThree calendars wearing one filename
Every row carries an event-type label, and the labels sort themselves into three families: 62 distinct labels, every one beginning “Permit”, “Administrative Reservation” or “Venue Rental”. This page never adds the three together into an “events” number, and the file itself shows why. The busiest-looking year in the ledger is 2015, with 14,757 rows — but 7,298 of those are administrative-reservation rows. Count only the permit lane and the busiest year is 2014, with 9,717. A reader who blends the lanes finds a different peak, a year away from the permit calendar’s.
| Year | All rows | Permit lane | Administrative lane |
|---|---|---|---|
| 2012 | 5,533 | 5,533 | 0 |
| 2013 | 8,989 | 8,327 | 662 |
| 2014 | 11,928 | 9,717 | 2,211 |
| 2015 | 14,757 | 7,343 | 7,298 |
| 2016 | 14,450 | 8,229 | 5,521 |
| 2017 | 11,359 | 7,167 | 3,651 |
| 2018 | 11,180 | 7,115 | 3,562 |
| 2019 | 10,357 | 6,567 | 3,243 |
| 2020 | 2,953 | 1,903 | 955 |
| 2021 | 6,109 | 4,719 | 1,108 |
| 2022 | 7,188 | 4,705 | 2,037 |
| 2023 | 8,677 | 6,415 | 1,780 |
| 2024 | 10,115 | 6,685 | 2,951 |
| 2025 | 10,466 | 6,299 | 3,695 |
| 2026 | 8,305 | 6,041 | 1,879 |
The administrative lane is not small print: 40,553 rows — 28.5 percent of the file — carry labels like “Internal Hold PARKS” (24,022) and “Internal Hold REVENUE” (8,711). What the district holds its own spaces for, the labels do not say, and this page does not guess. The third lane is the Venue Rental family of labels: Venue Rental – Social (2,151), Wedding (1,867), Cultural Arts (523), Philanthropic (228), Education (157), Corporate (71), Civic (51) — 5,048 rows, every one of them accounted for by those seven labels.
A calendar of yeses
Across the whole file, 125,268 rows — 88.0 percent — are marked Approved, and most of the rest are marked Tentative (16,652, concentrated in the administrative lane). Within the permit lane the approval share rises to 98.0 percent: 94,861 Approved of 96,765, with 1,581 Tentative, 256 On Hold, and a scattering of Completed, Waiting Decision and Issued. The label “Stage Denied” — the only status in the file that reads as a refusal — appears 13 times in fifteen years, 11 of them in the permit lane. Does the Park District turn people down? This file cannot say: it records reservations that reached the calendar, it does not claim to hold every request made, and 13 refusal-labeled rows is a fact about this file’s labels, not a denial rate. The honest reading stops there.
What the permit lane is for
The permit lane’s own top ten, counted as the labels print:
| Permit-lane event type | Rows, 2012–2026 |
|---|---|
| Permit – Athletic Training | 31,821 |
| Permit – Athletic T Cluster 3 | 8,455 |
| Permit – Media: Non-Commercial Photography Online | 6,128 |
| Permit – Event 6/10,000+ | 5,751 |
| Permit – Festival/Performance/12,001+ Event | 5,614 |
| Permit – Media: Non-Commercial Photography | 4,285 |
| Permit – Event 1 Cluster 3 | 3,679 |
| Permit – Picnic Level 1 | 3,018 |
| Permit – Corporate Event Level 3 | 2,505 |
| Permit – Event 1 Cluster 1 | 1,995 |
Athletic training alone is 31,821 rows — 32.9 percent of every permit in the lane. Add the second athletic label and more than four in ten permit rows carry an athletic-training label. Photography is its own economy: the two non-commercial photography labels total 10,413 rows. A venue oddity sits nearby: “Lincoln Ben Franklin Statue” is one of the most-reserved spots in the file, at 1,821 rows — what those reservations are for, the venue column does not say. The picnic ladder runs 5,114 rows from Level 1 (3,018) down to Level 4 (197). And the big-event tiers are busier than either: 5,751 rows at the “10,000+” class and 5,614 at “12,001+” — attendance classes on the label, not counted heads.
The April with 59 rows
In April 2020 the whole file — all three lanes together — holds 59 rows. The month before held 120; an ordinary April holds thousands. The year finished at 2,953 rows against 10,357 the year before, and the permit lane’s 2020 count, 1,903, is the lowest in the file. Recovery has been partial and uneven: 6,415 permit-lane rows in 2023, 6,685 in 2024, 6,299 in 2025 — bracketing 2019’s 6,567 (2024 above it, the other two below) and every one of them at least 31 percent short of 2014’s 9,717. The dates are the file’s; the cause of 2020’s crater is not recorded in it, and the question of why the latest full year, 2025, runs 35 percent below the 2014 peak stays open.
Where and when the parks get booked
August is the calendar’s summit: 17,009 permit-lane rows across the file’s fifteen years, 11.3 times January’s 1,505. July and August together hold 35.0 percent of every permit-lane row. The venues run 2,646 distinct facility names across 408 numbered parks, and the top of the table is not a stadium or a lakefront lawn — it is the Garfield Park Conservatory’s show rooms (the venue label reads “Garfield Conservatory All Show Rooms”), 5,671 rows since 2012 and 516 already in 2026, ahead of Lakeshore East Park (3,409) and the Lincoln Park Conservatory’s show rooms (2,509). A greenhouse is the most-reserved space in this file’s fifteen years — the file counts the reservations, and leaves the why to the reader. The calendar also runs ahead of today: 1,767 rows are dated after August 25, 2026, reaching to New Year’s Eve; 914 rows across the file span more than one day.
- Source: the Chicago Park District – Outdoor Event Permits file (pk66-w54g) on the city’s data portal: 142,366 rows dated by reservation start, January 7, 2012 through December 31, 2026; retrieved August 25, 2026. All figures were computed on the portal; no row-level file was downloaded.
- A separate government: the Chicago Park District is its own unit of government, distinct from the City of Chicago; nothing on this page attributes its calendar to a city department.
- Privacy: the file carries requestor and organization columns; neither was ever selected in any query. No applicant — person or organization — is named or counted on this page.
- Lanes and labels: the 62 event-type labels are counted exactly as printed and split by their own prefixes into a Permit lane (96,765 rows), an Administrative Reservation lane (40,553), and a Venue Rental lane (5,048); the three are never summed into one events figure. Attendance tiers in label names are size classes, not counts of people.
- Dates: rows are dated by reservation start; 2026 is both partial and forward-looking — the file already holds 1,767 bookings dated after retrieval. Approval shares name their denominators where they appear.
Computed by KCM Desk from the Park District’s reservation records on the city’s portal, retrieved August 25, 2026. Human-guided and edited — about this desk. If you spot an error, corrections come first.