
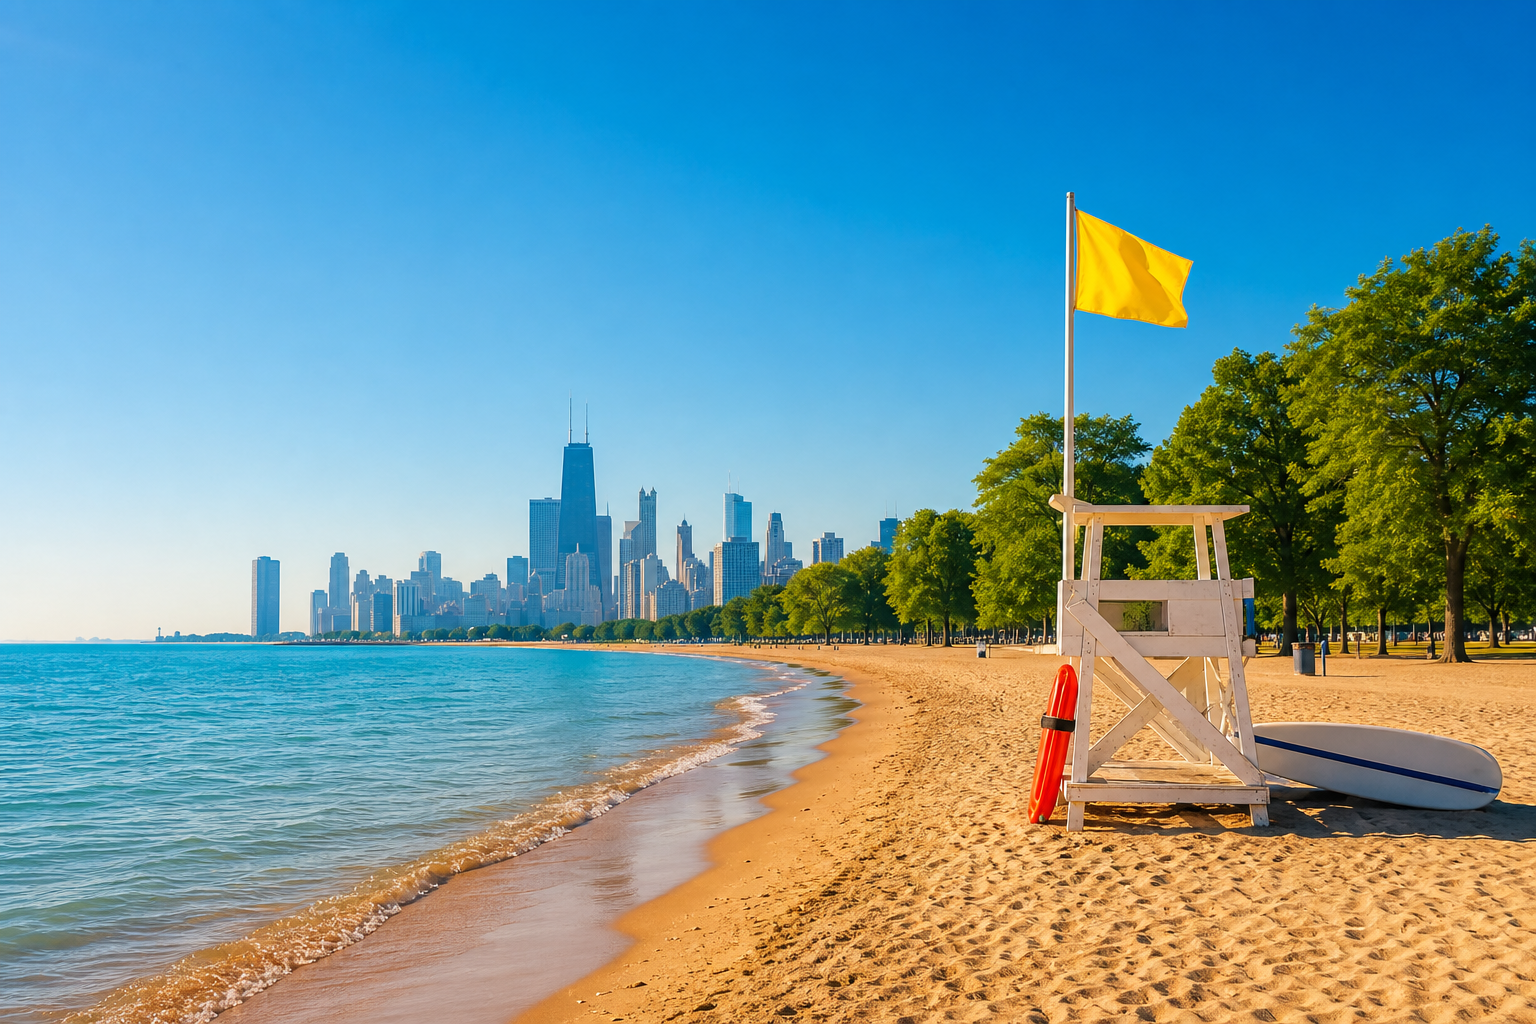

Every swimming day, the Chicago Park District tests the water at each beach. When the reading reaches 1,000, a yellow advisory flag goes up.
Since 2021 that flag has flown 5.0% of the time across the lakefront · and 7.2 times as often at one beach as at anotherThe Park District ran 9,524 of these tests on lakefront water since the start of 2021, and 473 of them came back at or above the advisory threshold. That is the lakefront average, and it is not much use to anybody, because the average is not what you swim in. You swim at one beach.
The water at 63rd Street reaches that threshold 10.3% of the time. At North Avenue, 1.4%. Both are Chicago beaches, both sit on the same lake, and the Park District runs the same test at both across the same seasons. The flag goes up at one about 7.2 times as often as at the other.
It is not a north-versus-south story, which is the first thing we checked
The chart above keeps the beaches in the order you would drive past them, north to south, for one reason: to show that the long pennants do not bunch at either end. The two worst beaches on the lakefront are 63rd Street on the South Side and Montrose on the North Side. Two of the cleanest, North Avenue and Oak Street, sit downtown between them. Foster and Osterman on the North Side are near the bottom of the table, and so is 57th Street on the South Side. Whatever sorts these beaches, a simple north-south split does not describe it.
What the five worst have in common
- 63rd Streetnext to Jackson Park Inner Harbor10.3%
- Montrosenext to Montrose Harbor9.4%
- Calumetnext to the Calumet River mouth8.8%
- Margaret T Burroughs (31st)next to 31st Street Harbor8.7%
- Ohio Streetnext to DuSable Harbor and Navy Pier8.2%
Every one of the five sits beside a harbor or a river mouth. That is a tidy pattern and we want to be careful with it. The adjacency is a fact you can check on a map; why it might matter is a guess, and this dataset cannot test any guess, because it records water readings and nothing about currents or outfalls. There is also a beach that does not fit. 57th Street sits a few hundred yards from 59th Street Harbor and is one of the cleanest on the list at 2.7%. Sheltered water may be part of the answer. It is plainly not the whole of it.
The lagoon is a different animal
One beach in the city is not on Lake Michigan at all. The beach at Humboldt Park is an inland lagoon, and it reaches the advisory threshold 17.1% of the time — about 3.4 times the lakefront rate. We have kept it out of every lakefront figure on this page rather than letting it drag the averages, because a shallow enclosed lagoon and a Great Lake are not the same test. It is also sampled less often: 240 tests against roughly 560 at a typical lake beach.
How we counted
- Source: the Park District’s own Beach Lab Data (2ivx-z93u), the rapid DNA tests run on lake water through the swimming season. Latest sample in this analysis: July 18, 2026.
- The threshold is theirs, not ours. The Park District posts a yellow swim-advisory flag when the DNA reading reaches 1,000 CCE per 100 millilitres. Every percentage on this page is the share of tests at or above that number. The older culture-based E. coli test uses a different unit and a different action level (235 CFU), and we have not mixed the two.
- Window: 2021 onward. The 2020 season has only 47 readings citywide, and a small number of rows carry broken timestamps; the date filter drops both.
- The beaches are sampled evenly, which is what makes the comparison fair: every lakefront beach here has between 551 and 566 tests over the period, so no beach’s rate rests on a thin sample.
- Seasons vary, so do not read one summer as a trend: the flag rate across all tested beaches, the lagoon included, runs 2021 9.3% · 2022 4.2% · 2023 2.3% · 2024 5.7% · 2025 5.9% · 2026 3.0%. Note that 2026 covers only part of a season, through July 18, so it is not yet comparable with the full years beside it.
- What this is not: a safety rating. A test tells you about the water at one spot at one moment, conditions change after rain, and the Park District posts the live call at the beach and on its own advisory page. Check that before you swim, not this.
Computed by KCM Desk from Chicago Park District lab records through July 18, 2026; published July 19, 2026. Human-guided and edited — about this desk. If you spot an error, corrections come first.
Related Keep Chicagoland Moving coverage
- Chicago’s 2026 Beach Sampling Season Ended September 7 With 57 of 1,898 Rapid-Test Readings Above the Advisory Level — 3.0 Percent, the Second-Lowest of Twelve Summers
- Is Lake Michigan Warmer Than the Air? Chicago’s Paired Beach Sensors Recorded the Water Warmer on About One Matched Hour in Three
- Chicago Floated Water Sensors at Six Beaches. All but 39 of the 16,588 Hourly Records Since 2017 Carry One Beach’s Label — Ohio Street, Whose July 2026 Averaged 73.8°F
- Chicago Measures Its Own Air Now: 286 Sensors, 2,544,089 Hourly Readings — and 96 Percent of Its 100-Plus PM2.5 Hours Landed on Two July Dates
- The Park District’s Event File Is Three Calendars in One: 96,765 Permit Rows, 40,553 Administrative Reservations, 5,048 Venue Rentals — and 13 Rows Marked Denied Since 2012
- How Chicago Works, by the Numbers
- Every Chicago Lakefront Beach, Ranked by Advisory-Level Water Tests
- Chicago’s Crashes Peak at 3 p.m. The Odds of Dying in One Peak at 3 a.m.
- A Chicago 311 Garbage-Cart Request Took a Median 15.9 Days to Close, a Pothole 5.8 and a Traffic-Signal-Out Report 3 Hours: 883,837 Requests Timed by Community Area
- One Map, Three Chicagos