
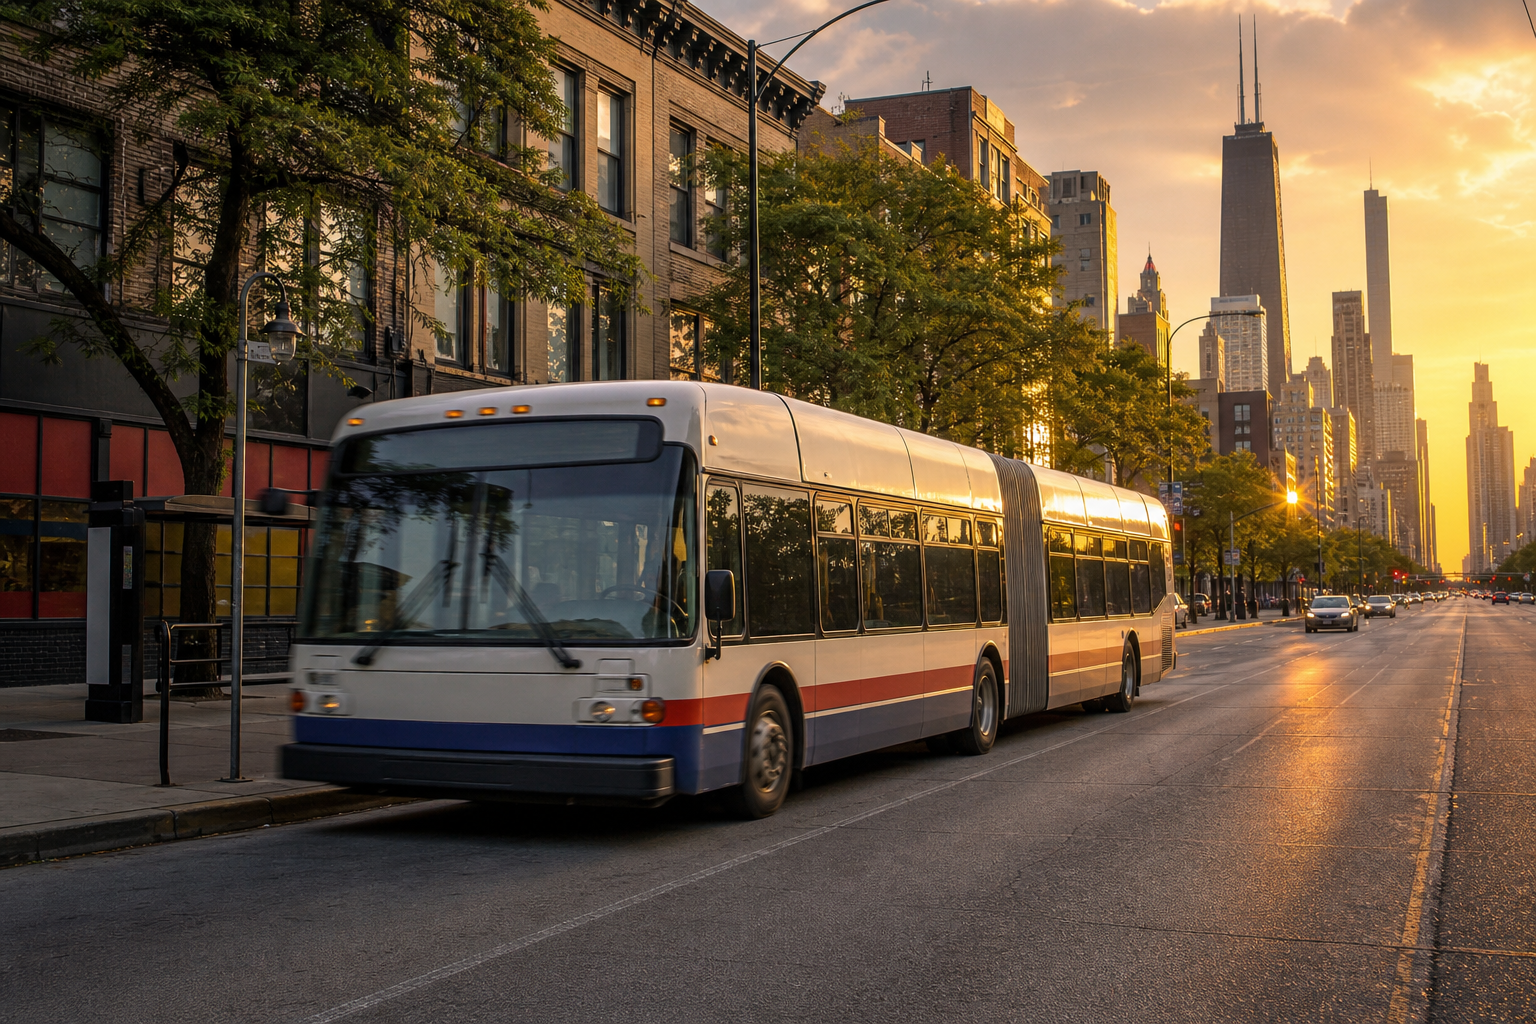

Which bus carries Chicago? The CTA’s route file — “monthly averages, by day type (weekday, Saturday or Sunday/Holiday) and monthly totals for all CTA bus routes, back to 2001” — answers in 41,267 route-month rows, and June 2026 crowns the 9 Ashland: 549,149 rides for the month, ahead of the 53 Pulaski and the 79 79th, across 127 routes that together logged 17,278,266. But the record book belongs to one route alone: every month in this file’s history that cleared a million rides — there are exactly five — belongs to the 79 79th, topping out at 1,058,879 in October 2008.
CTA — Ridership — Bus Routes — Monthly Day-Type Averages & Totals (bynn-gwxy), 41,267 rows, one per route per month, January 2001 through June 2026, retrieved September 8, 2026; the whole file was downloaded and every figure recomputed · route-level ride figures, never mixed with the systemwide daily ledger (read separately) or the L’s station entries (also separate) · the CTA is a separate agencyJune 2026, route by route
| Route, as filed | June 2026 rides | Avg. weekday |
|---|---|---|
| 9 Ashland | 549,149 | 18,546.4 |
| 53 Pulaski | 488,987 | 17,685.4 |
| 79 79th | 488,799 | 17,739.4 |
| 66 Chicago | 465,970 | 16,413.7 |
| 3 King Drive | 445,991 | 15,583.6 |
| 22 Clark | 431,991 | 14,395.6 |
| 4 Cottage Grove | 420,888 | 14,390.0 |
| 77 Belmont | 420,270 | 14,969.1 |
| 151 Sheridan | 419,974 | 13,703.9 |
| 8 Halsted | 417,109 | 14,933.3 |
No route reported zero. The smallest June belonged to the 19 United Center Express, at 1,761 rides — about 129 on an average weekday it ran — with the 165 West 65th and the 206 Evanston Circulator close by. A route’s size is a schedule as much as a street, and the file records outcomes, not service plans.
The million-ride club has one member
Five route-months in this file’s quarter century clear one million rides, and all five are the 79 79th: October 2008 (1,058,879), October 2007, October 2002, May 2008, and September 2008 (1,001,372). The same route’s June 2026 total is 488,799 — 57 percent of its June 2001 — which is how a route can hold the entire record book and third place in the same file. No cause is offered here for either fact.
Endpoints, June 2001 against June 2026
Across the 109 route numbers with rides in both Junes — endpoints of the file’s labels, not a service history — the biggest riser is the 146 Inner Lake Shore/Michigan Express, from 250,257 to 324,379. The 18 16th/18th more than doubled, from 38,179 to 93,410. And the 124 Navy Pier grew 12.6-fold, from 4,447 rides in June 2001 to 56,199 in June 2026. The steepest falls sit at the top of the old order: the 79 79th from 860,121 to 488,799, the 9 Ashland from 831,613 to 549,149, the 151 Sheridan from 682,513 to 419,974.
The Saturday routes, and 58 labels whose rows stop
In 1,745 route-months across the file, a route’s Saturday average beat its weekday average — and the 124 Navy Pier owns 225 of them, with the 1001 Shuttle/Special Event Route at 169 and the 36 Broadway at 149. And 58 of the file’s 186 route labels post no rows in the latest twelve months: the 5 South Shore Night Bus’s rows end with December 2024, the X98 Avon Express’s with March 2023, the 132 Goose Island Express’s with December 2018 — and one label, “992 ROAD CALL,” printed here exactly as filed, ends with June 2020. Last rows, not fates: the file says where its columns stop, and nothing more.
- Source: the CTA’s Bus Routes — Monthly Day-Type Averages & Totals file (bynn-gwxy): 41,267 rows, one per route per month, January 2001 through June 2026, retrieved September 8, 2026. The whole file was downloaded and every figure on this page recomputed; the CTA is a separate agency.
- Units: monthly figures are the file’s monthtotal column and day-type averages come from its own average columns; route-level figures are never combined with the systemwide daily ledger or the L’s station entries, which live in separate files and separate pieces.
- Comparisons: the 2001-vs-2026 read uses June against June for route numbers with nonzero rides in both months — label endpoints, stated as such. The million-ride count is an exact scan of all 41,267 rows.
- As filed: route numbers and names are the file’s own labels, including internal-looking ones; no cause is attributed to any rise, fall, or ending.
Computed by KCM Desk from the CTA’s bus-route file, retrieved September 8, 2026. Human-guided and edited — about this desk. If you spot an error, corrections come first.
Related Keep Chicagoland Moving coverage
- Chicago Transit, by the Numbers
- Which L Stop Logs the Most Entries? Clark/Lake Leads June 2026 — and One Station’s Saturday Average Has Beaten Its Weekday Average in 214 Months
- The CTA’s Own Daily Ledger: 11.06 Billion Boardings Since 2001, a Two-Million-Ride Day in 2008 — and a Recovery the Bus Is Carrying
- Did You Know? Chicago, by Its Own Records