
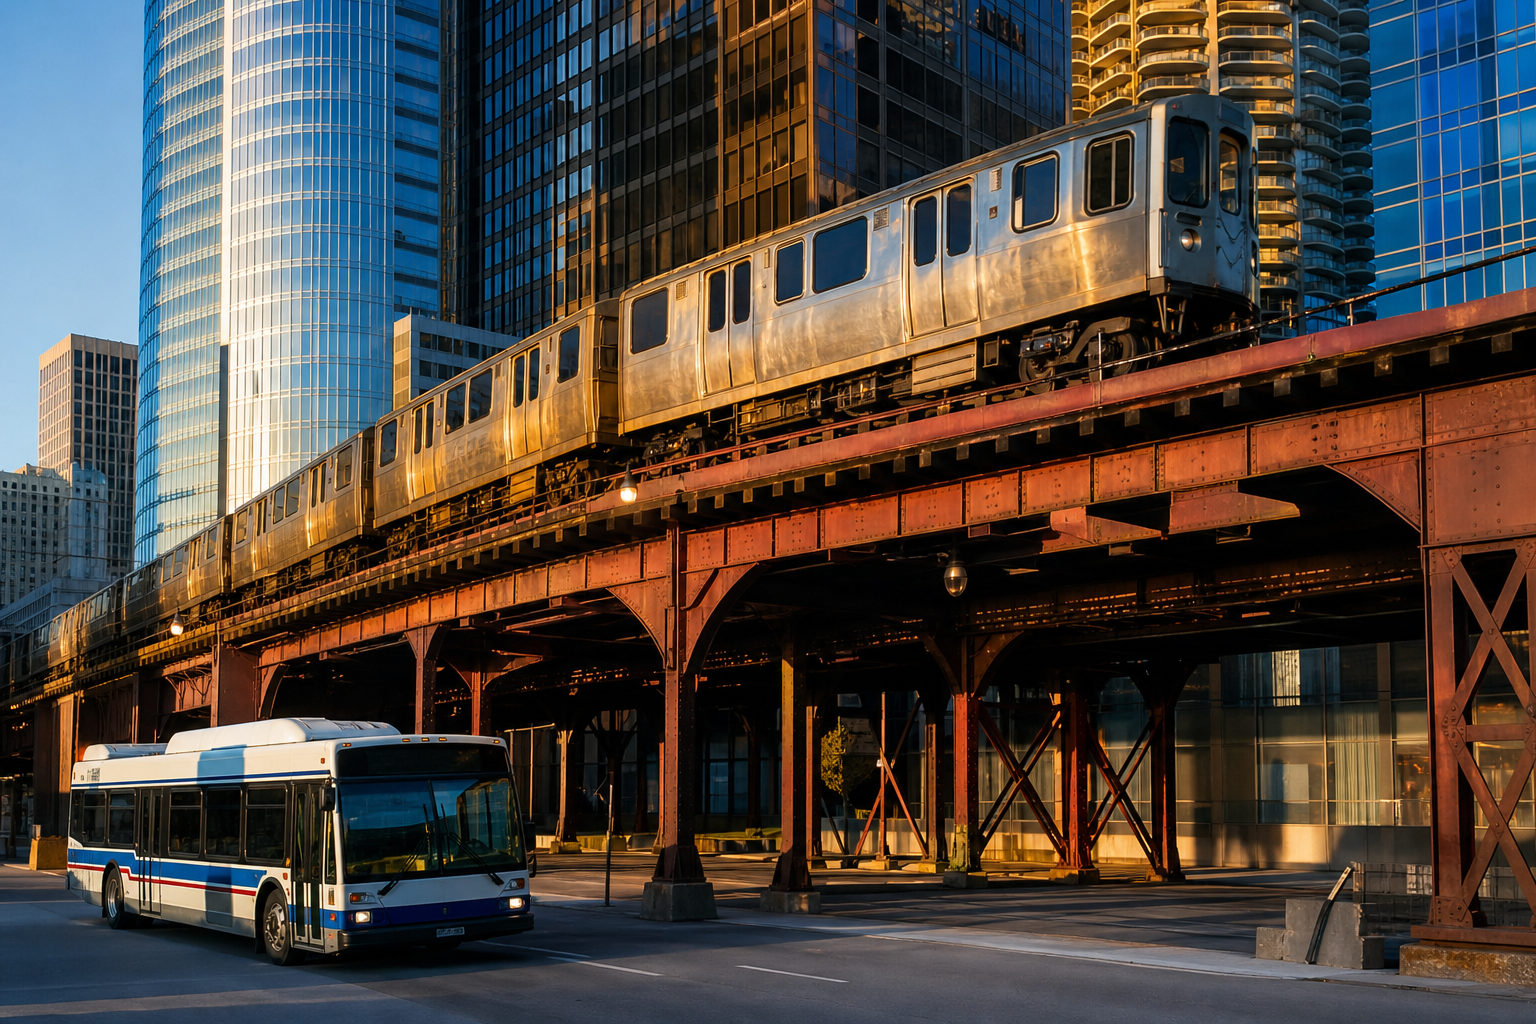

The Chicago Transit Authority — a separate agency, not a city department, though it posts this file on the city’s portal — has published a one-row-per-day ledger of its systemwide boardings since January 1, 2001. Read whole, all 9,312 days of it: 11,061,239,838 boardings across the 25 full years, 2001 through 2025 — eleven billion rides, counted as rides, not people. The ledger’s biggest single day is July 3, 2008, at 2,049,519 boardings; its smallest is May 31, 2020, at 110,047. Its peak year is 2012, at 545.6 million; its smallest is 2021, at 196.0 million; 2025 closed at 338.0 million — 74.2 percent of 2019. And inside the recovery sits the file’s quietest big story: buses were 52.1 percent of all CTA boardings in 2019 and are 59.9 percent so far in 2026. The system that is coming back is more of a bus system than the one that shut down.
CTA – Ridership – Daily Boarding Totals (6iiy-9s97), 9,312 daily rows, January 1, 2001 – June 30, 2026 · retrieved August 27, 2026 · the whole file was downloaded and every figure recomputed from it · boardings are rides as the CTA counts them, not people · day types as the portal defines them: “W = Weekday, A = Saturday, U = Sunday/Holiday”A quarter century, year by year
| Year | Total boardings | Bus | Rail | Avg. weekday |
|---|---|---|---|---|
| 2001 | 483,405,757 | 301,712,869 | 181,692,888 | 1,571,863 |
| 2008 | 526,336,470 | 328,199,217 | 198,137,253 | 1,679,117 |
| 2012 | 545,577,922 | 314,423,583 | 231,154,339 | 1,725,615 |
| 2019 | 455,743,540 | 237,276,399 | 218,467,141 | 1,468,731 |
| 2020 | 197,499,791 | 121,449,920 | 76,049,871 | 623,202 |
| 2021 | 195,980,570 | 117,357,522 | 78,623,048 | 601,803 |
| 2022 | 243,538,810 | 140,013,952 | 103,524,858 | 762,564 |
| 2024 | 309,197,034 | 181,733,625 | 127,463,409 | 953,787 |
| 2025 | 338,041,690 | 199,648,793 | 138,392,897 | 1,042,505 |
| 2026 (Jan–Jun) | 168,422,106 | 100,809,775 | 67,612,331 | 1,044,881 |
The shape is not a single arc. Boardings climbed to the file’s peak year, 2012, slid gently through the late 2010s — 2019’s 455.7 million was already 16 percent below the peak — then fell off a cliff to 2021’s 196.0 million. The average weekday tells it fastest: 1,571,863 boardings in 2001; 1,468,731 in 2019; 601,803 in 2021; 1,042,505 in 2025. Why any of it moved is not in this file, and this page adds no cause.
The biggest and smallest days in the ledger
| Date | Day type | Total boardings |
|---|---|---|
| 2008-07-03 | W | 2,049,519 |
| 2016-11-04 | W | 1,945,417 |
| 2008-11-04 | W | 1,938,738 |
| 2012-10-03 | W | 1,926,454 |
| 2008-10-01 | W | 1,922,280 |
The single biggest rail day on the ledger is November 4, 2016 — 1,146,516 rail boardings, inside a 1,945,417-boarding day. At the other end: the file’s smallest day is Sunday, May 31, 2020, at 110,047 boardings, and its two runners-up are Christmas Days (2020 and 2022). The smallest weekday ever recorded is June 1, 2020 — 174,448 boardings, of which just 27,517 were rail, the thinnest rail column in any weekday row of the file. What closed, and why, is for the record of that week, not this ledger; the numbers themselves are as filed.
The bus is carrying the recovery
In 2001, 62.4 percent of all CTA boardings were bus boardings. That share fell for nearly two decades as rail grew — 59.2 percent in 2010, 52.1 in 2019. Then the pattern inverted: the bus share jumped to 57.5 percent in 2022 and has held near there since — 59.1 percent across 2025, 59.9 percent in the first half of 2026. Our derivation, labeled as ours and stated in the file’s own unit: rail boardings fell further after 2020 than bus boardings did and have come back more slowly, so a measurably larger share of today’s boardings happens on a bus than in 2019. The file counts boardings, not reasons, and the reason stays open.
Where does the recovery stand now? Matched month against matched month: June 2026’s 30,086,142 boardings are 78.0 percent of June 2019’s 38,578,037 — a few points ahead of the full-year 2025-to-2019 share of 74.2 percent. Whether that gap keeps closing is a question for the ledger’s future rows, and this page makes no forecast.
- Source: the CTA’s Ridership – Daily Boarding Totals file (6iiy-9s97) on the city’s data portal: 9,312 rows, one per service day, January 1, 2001 through June 30, 2026; retrieved August 27, 2026. The whole file was downloaded and every figure on this page — sums, averages, minima, maxima — was recomputed from the daily rows.
- A separate agency: the Chicago Transit Authority is its own unit of government; nothing on this page attributes its ridership to a city department.
- Units: boardings are rides as the CTA counts them — a person who transfers can board more than once in a trip — and no figure here is a count of people. Day-type labels are the portal’s: “W = Weekday, A = Saturday, U = Sunday/Holiday.”
- Dates, not causes: the largest and smallest days are printed as dates with no event attributed; the file does not record why a day was big or small, and neither does this page. 2026 is a partial year, January through June, and is labeled so wherever it appears.
Computed by KCM Desk from the CTA’s daily boarding ledger, retrieved August 27, 2026. Human-guided and edited — about this desk. If you spot an error, corrections come first.
Related Keep Chicagoland Moving coverage
- Which Bus Carries Chicago? The 9 Ashland Leads June 2026 — but Every Million-Ride Month in the File Belongs to the 79 79th
- Which L Stop Logs the Most Entries? Clark/Lake Leads June 2026 — and One Station’s Saturday Average Has Beaten Its Weekday Average in 214 Months
- Chicago Ran a Speedometer Made of Buses for Eight Years: 3 a.m. Is 7.5 mph Faster Than 4 p.m., and the Loop at 5 p.m. Averages 13.9
- Chicago Transit, by the Numbers
- Chicago’s Rideshare Roster: 86,195 Driver Records in June 2026, Little More Than Half Its 2017 Peak — and a Third of Them Recorded Zero Trips
- In June 2026, a Chicago Taxi Mile Cost $4.17 and a Rideshare Mile $4.21 — and the Fare Dollar Split Opposite Ways
- Did You Know? Chicago, by Its Own Records