
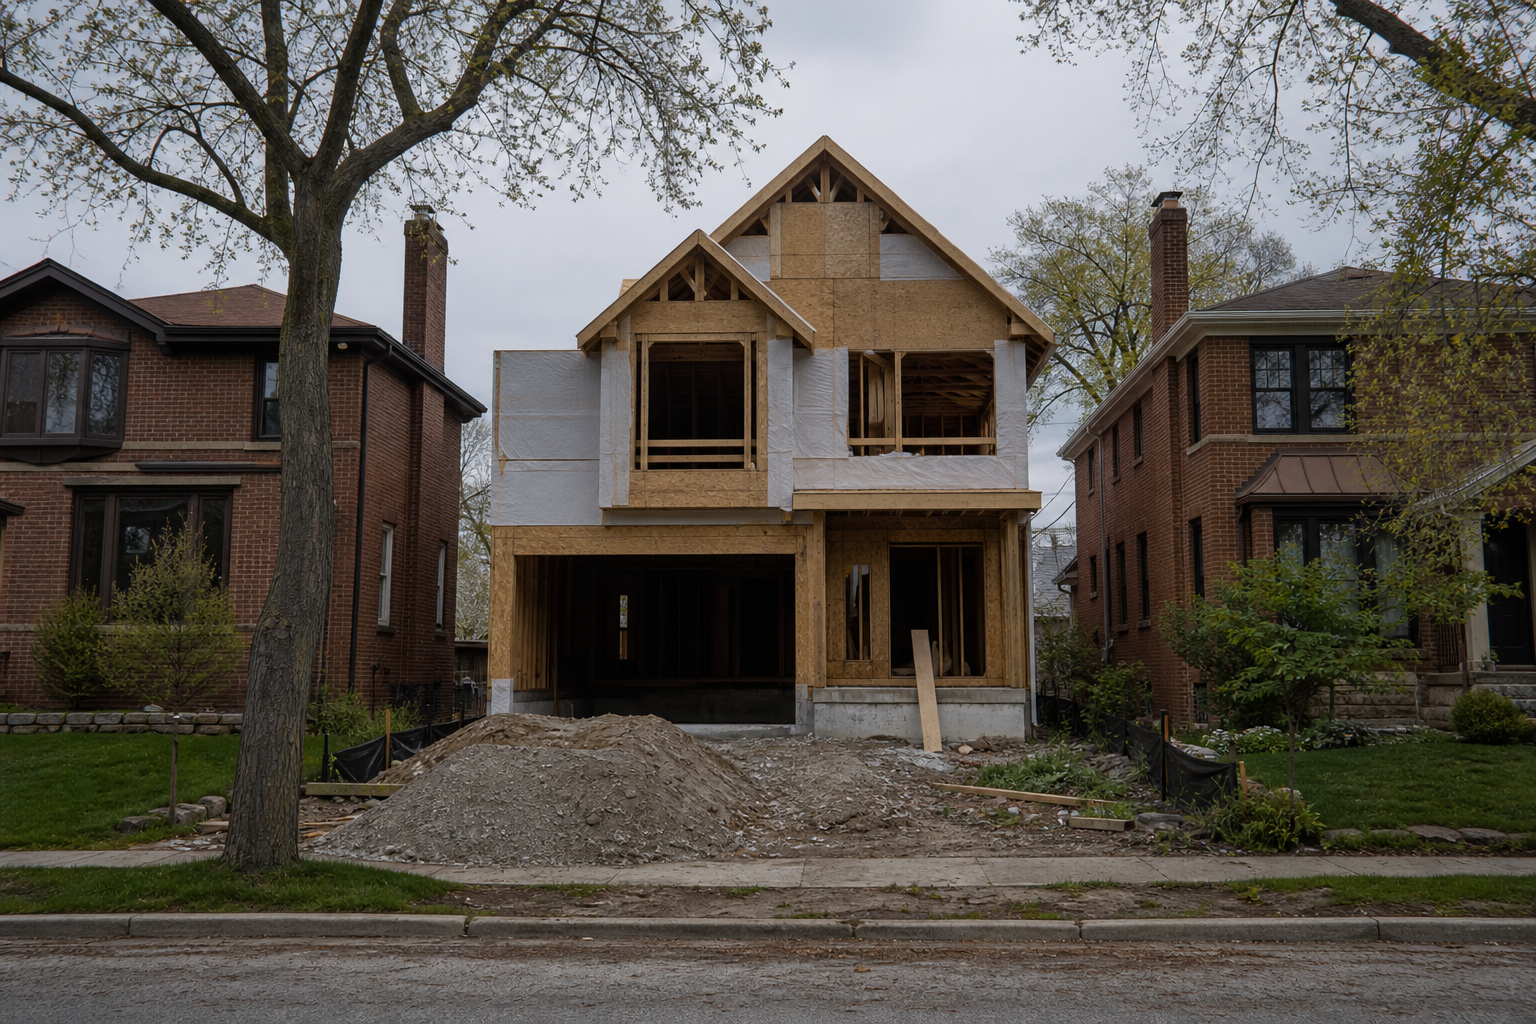

Since 2008, Cook County’s count of houses and small apartment buildings has risen by just 3,087, and the split is lopsided: the 30 suburban townships gained 6,351 while Chicago’s eight townships lost 3,260, by the assessor’s count. Lake township alone lost 3,075, nearly the county’s whole net gain. From 2000 to 2008 the count had grown by 21,986, most of it in the suburbs.
Single and Multi-Family Improvement Characteristics (x54s-btds), maintained by the Cook County Assessor’s Office, tax years 2000, 2008 and 2025, retrieved September 18, 2026; last updated September 15, 2026 · one row per building: single-family houses and buildings of fewer than seven units · every change is net — buildings added minus buildings that left these classesChicago’s townships and the suburbs
| Area | 2000 | 2008 | 2025 | Change, 2000–2008 | Change, 2008–2025 |
|---|---|---|---|---|---|
| Chicago’s eight townships | 441,654 | 442,685 | 439,425 | +1,031 | −3,260 |
| The 30 suburban townships | 636,320 | 657,271 | 663,622 | +20,951 | +6,351 |
| No township listed | 0 | 4 | 0 | +4 | −4 |
| All of Cook County | 1,077,974 | 1,099,960 | 1,103,047 | +21,986 | +3,087 |
The suburbs’ gain shrank from 20,951 buildings in the eight years to 2008 to 6,351 in the seventeen since, and Chicago’s townships went from a gain of 1,031 to a loss of 3,260. Put the two periods side by side and net growth fell from about 2,700 buildings a year to about 180.
Where the growth went, and where it slowed
From 2000 to 2008 the largest net gains were in Hanover township, 3,661, Orland, 3,484, and Rich, 3,244 — together 10,389. Since 2008 the same three have added 1,791. The losses since 2008 are concentrated in Chicago: Lake township, down 3,075, West Chicago, down 965, and Lake View, down 557, with Thornton, down 764, the largest suburban loss. Lemont gained the most relative to its size, 1,334 buildings or 19.6 percent, and South Chicago township is the only Chicago township to gain more than a thousand in either period: 1,560, then 1,085.
Township by township
| Township | Group | 2000 | 2008 | 2025 | Change, 2000–2008 | Change, 2008–2025 | Percent, 2008–2025 |
|---|---|---|---|---|---|---|---|
| Lake | Chicago | 146,588 | 146,381 | 143,306 | −207 | −3,075 | −2.1% |
| West Chicago | Chicago | 66,675 | 66,629 | 65,664 | −46 | −965 | −1.4% |
| Thornton | Suburban | 53,809 | 54,242 | 53,478 | +433 | −764 | −1.4% |
| Lake View | Chicago | 24,386 | 23,603 | 23,046 | −783 | −557 | −2.4% |
| Hyde Park | Chicago | 64,659 | 64,982 | 64,704 | +323 | −278 | −0.4% |
| Calumet | Suburban | 4,874 | 4,908 | 4,730 | +34 | −178 | −3.6% |
| Bloom | Suburban | 26,670 | 27,585 | 27,442 | +915 | −143 | −0.5% |
| Leyden | Suburban | 23,391 | 23,359 | 23,297 | −32 | −62 | −0.3% |
| Niles | Suburban | 31,872 | 31,856 | 31,794 | −16 | −62 | −0.2% |
| Cicero | Suburban | 13,867 | 13,818 | 13,767 | −49 | −51 | −0.4% |
| Elk Grove | Suburban | 18,054 | 18,031 | 17,980 | −23 | −51 | −0.3% |
| North Chicago | Chicago | 5,609 | 5,520 | 5,481 | −89 | −39 | −0.7% |
| Riverside | Suburban | 5,286 | 5,277 | 5,262 | −9 | −15 | −0.3% |
| Proviso | Suburban | 41,989 | 41,996 | 41,984 | +7 | −12 | −0.03% |
| Norwood Park | Suburban | 8,140 | 8,216 | 8,214 | +76 | −2 | −0.02% |
| New Trier | Suburban | 18,209 | 18,328 | 18,330 | +119 | +2 | +0.01% |
| Berwyn | Suburban | 12,989 | 12,989 | 12,994 | 0 | +5 | +0.04% |
| Rogers Park | Chicago | 7,916 | 7,809 | 7,814 | −107 | +5 | +0.1% |
| Stickney | Suburban | 12,120 | 12,270 | 12,293 | +150 | +23 | +0.2% |
| River Forest | Suburban | 2,934 | 2,950 | 2,977 | +16 | +27 | +0.9% |
| Worth | Suburban | 42,911 | 43,406 | 43,461 | +495 | +55 | +0.1% |
| Oak Park | Suburban | 11,200 | 11,333 | 11,448 | +133 | +115 | +1.0% |
| Bremen | Suburban | 31,182 | 32,746 | 32,865 | +1,564 | +119 | +0.4% |
| Evanston | Suburban | 12,931 | 13,028 | 13,171 | +97 | +143 | +1.1% |
| Palos | Suburban | 13,108 | 13,818 | 14,003 | +710 | +185 | +1.3% |
| Rich | Suburban | 18,980 | 22,224 | 22,475 | +3,244 | +251 | +1.1% |
| Barrington | Suburban | 4,640 | 5,215 | 5,577 | +575 | +362 | +6.9% |
| Wheeling | Suburban | 35,680 | 36,011 | 36,373 | +331 | +362 | +1.0% |
| Schaumburg | Suburban | 29,541 | 30,051 | 30,491 | +510 | +440 | +1.5% |
| Maine | Suburban | 34,892 | 34,972 | 35,463 | +80 | +491 | +1.4% |
| Lyons | Suburban | 29,151 | 29,908 | 30,466 | +757 | +558 | +1.9% |
| Jefferson | Chicago | 111,979 | 112,359 | 112,923 | +380 | +564 | +0.5% |
| Hanover | Suburban | 20,905 | 24,566 | 25,178 | +3,661 | +612 | +2.5% |
| Northfield | Suburban | 21,804 | 23,172 | 23,927 | +1,368 | +755 | +3.3% |
| Palatine | Suburban | 25,536 | 26,595 | 27,519 | +1,059 | +924 | +3.5% |
| Orland | Suburban | 24,095 | 27,579 | 28,507 | +3,484 | +928 | +3.4% |
| South Chicago | Chicago | 13,842 | 15,402 | 16,487 | +1,560 | +1,085 | +7.0% |
| Lemont | Suburban | 5,560 | 6,822 | 8,156 | +1,262 | +1,334 | +19.6% |
Since 2008, 23 townships gained buildings and 15 lost them, five of the losers in Chicago. A net figure hides its parts: a township that tore down and rebuilt at the same pace would show no change at all. The earlier analysis of the county’s housing age estimates, under stated assumptions, that roughly 21,394 or more buildings in the 2008 rows are no longer in the 2025 rows. If so, the modest net figures here sit on top of much larger turnover in the file’s rows.
What the file confirms, and what it cannot tell you
Confirmed, as recorded: how many buildings the assessor lists in each township for each tax year. Not shown: how many were built or torn down, since a building can also leave these classes by becoming condominiums or changing class; condominiums and buildings of seven or more units, which the file does not carry; and why any township gained or lost. The comparison starts in 2000 because 1999, the file’s first year, holds 18,272 fewer rows than 2000, and it ends in 2025 because the 2026 rows are not final. This analysis used only grouped counts, never a parcel number or an address.
Where the record lives
The Single and Multi-Family Improvement Characteristics file and the current-year Parcel Universe, which supplied the township names, sit on Cook County’s data portal. Every figure here was computed from them as retrieved on September 18, 2026.
The bottom line
Cook County’s net growth in houses and small apartment buildings slowed from 21,986 in 2000–2008 to 3,087 in 2008–2025. The suburbs still gained, 6,351, while Chicago’s townships lost 3,260, most of it in Lake township.
Three questions the file can answer
Which township lost the most since 2008? Lake, 3,075. Which gained the most since 2008? Lemont, 1,334. Which grew most from 2000 to 2008? Hanover, 3,661.
- Source: the Cook County Assessor’s Single and Multi-Family Improvement Characteristics file (x54s-btds), tax years 2000, 2008 and 2025, retrieved September 18, 2026.
- Read: grouped counts of buildings by tax year and township; no parcel number, address or owner field selected.
- Townships: names and groups from the assessor’s current-year Parcel Universe (pabr-t5kh).
- Not here: construction, demolition, condominiums, and any cause for a change.
Computed by KCM Desk from the Cook County Assessor’s Single and Multi-Family Improvement Characteristics file, retrieved September 18, 2026. Human-guided and edited — about this desk. If you spot an error, corrections come first.
Related Keep Chicagoland Moving coverage
- Chicago Housing, by the Numbers
- Half of Cook County’s Houses and Small Apartment Buildings Date From 1954 or Earlier — and 2.2 Percent From 2010 or Later, by the Assessor’s Count
- Cook County’s Condo Count Grew 73 Percent From 1999 to 2010, by the Assessor’s Count — Then Leveled Off: 372,354 Units in 2025, 63 Fewer Than in 2010
- After the Wrecking Ball: A Rebuild Permit Follows at 84 Percent of Logan Square’s Demolished Sites, and at None of West Pullman’s 137