
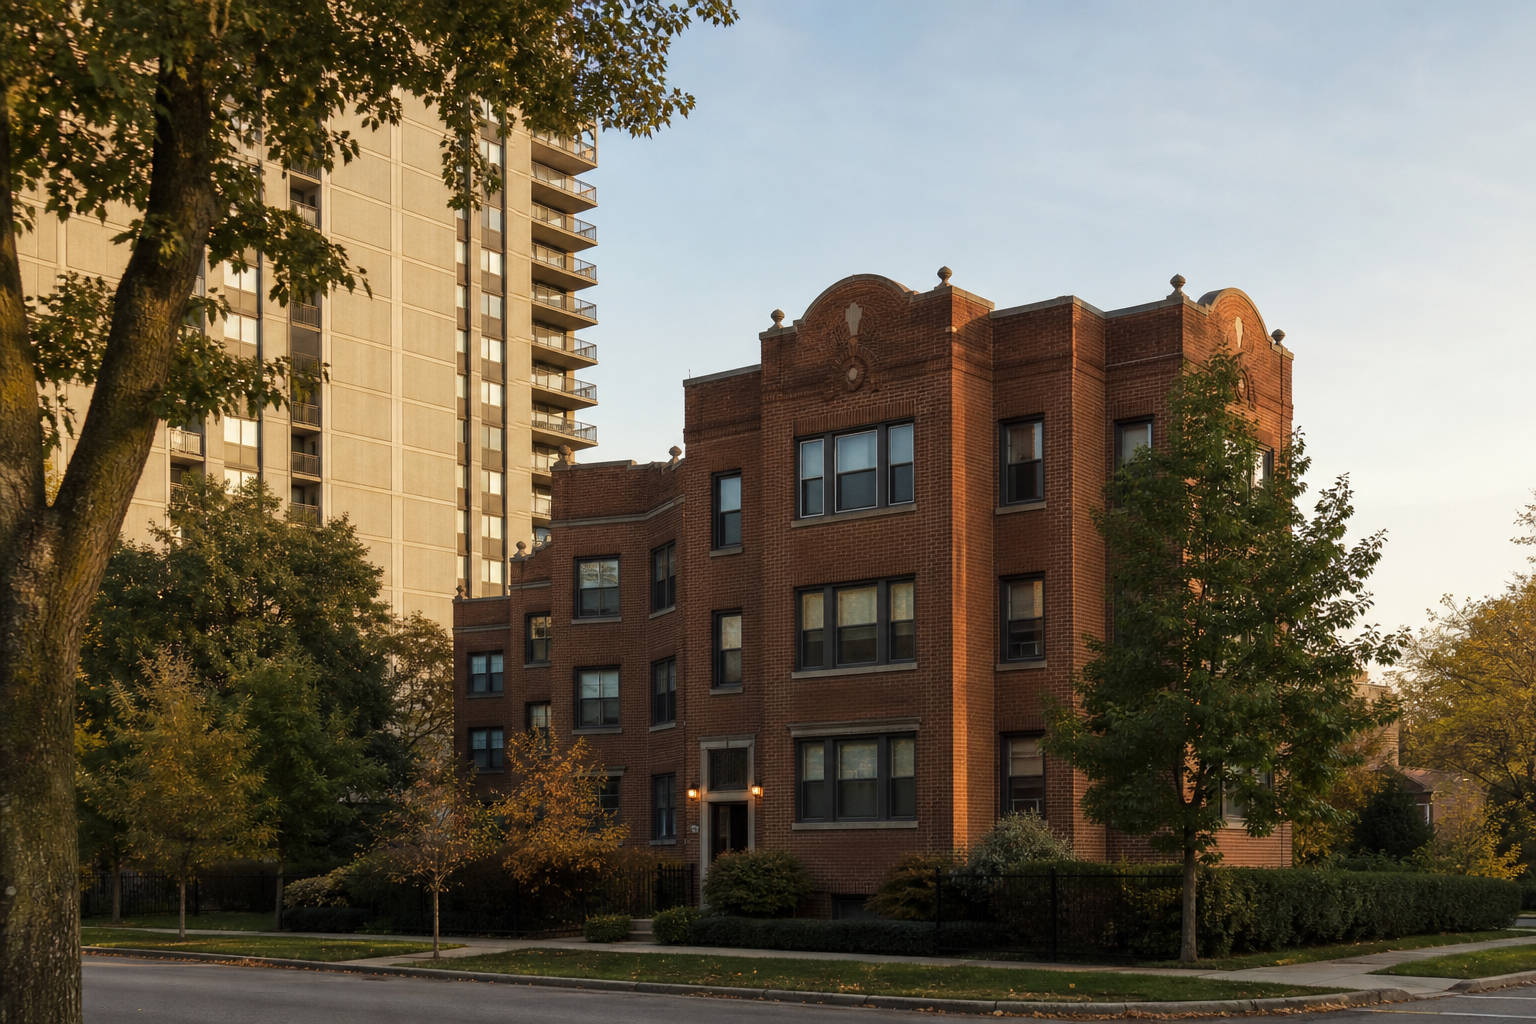

The Cook County Assessor’s condominium file counts 372,354 condo units in 2025 — 63 fewer than in 2010. Between 1999 and 2010 the count rose every year, by 157,452 units in all, or 73.2 percent, and then it leveled off. Half of that growth sat in buildings put up from 1999 on; the other half, by our reading, was older buildings becoming condominiums.
Residential Condominium Unit Characteristics (3r7i-mrz4), maintained by the Cook County Assessor’s Office, tax years 1999 through 2026 (the 2026 rows not yet final), retrieved September 18, 2026; last updated September 15, 2026 · units are rows the file does not flag as parking, storage or common areas · township names from the assessor’s Parcel Universe (pabr-t5kh) · units are not householdsTwelve years of growth, then a plateau
| Tax year | Condo units | Parking and storage parcels |
|---|---|---|
| 1999 | 214,965 | 20,830 |
| 2000 | 225,259 | 24,846 |
| 2001 | 237,220 | 29,392 |
| 2002 | 249,706 | 33,531 |
| 2003 | 262,277 | 38,388 |
| 2004 | 277,772 | 43,092 |
| 2005 | 293,351 | 49,424 |
| 2006 | 313,332 | 57,180 |
| 2007 | 337,181 | 65,115 |
| 2008 | 356,878 | 72,084 |
| 2009 | 367,421 | 78,116 |
| 2010 | 372,417 | 82,289 |
| 2011 | 374,052 | 82,869 |
| 2012 | 374,547 | 83,235 |
| 2013 | 374,321 | 83,128 |
| 2014 | 374,410 | 83,278 |
| 2015 | 374,392 | 83,538 |
| 2016 | 375,191 | 83,409 |
| 2017 | 375,507 | 83,466 |
| 2018 | 375,722 | 83,447 |
| 2019 | 374,764 | 83,616 |
| 2020 | 374,179 | 83,957 |
| 2021 | 374,618 | 84,045 |
| 2022 | 374,350 | 84,552 |
| 2023 | 372,608 | 84,809 |
| 2024 | 372,190 | 84,890 |
| 2025 | 372,354 | 84,631 |
The count climbed from 214,965 in 1999 to 372,417 in 2010, gaining in each of those years. Since then it has moved by less than one percent: it peaked at 375,722 in 2018 and stood at 372,354 in 2025, with 372,390 in the 2026 rows so far. The file also carries 84,631 parcels flagged as parking or storage in 2025 and 1,062 common areas, kept out of every unit count here.
New buildings and old ones
| Tax year | Units in buildings built before 1999 | Units in buildings built 1999 or later | All units |
|---|---|---|---|
| 1999 | 214,965 | 0 | 214,965 |
| 2010 | 293,752 | 78,665 | 372,417 |
| 2018 | 290,261 | 85,461 | 375,722 |
| 2025 | 279,789 | 92,565 | 372,354 |
Split the growth by the age of the building and it divides almost exactly in two. From 1999 to 2010, units in buildings built from 1999 on went from none to 78,665, and units in buildings built before 1999 rose by 78,787. Those older buildings did not go up in those years, so we read the second half as existing buildings becoming condominiums; the file records units, not conversions, so that reading is ours. The plateau since 2010 is two motions canceling out: newer buildings added 13,900 units while units in older buildings fell by 13,963.
Chicago’s townships and the suburbs
| Tax year | Chicago’s eight townships | The 30 suburban townships | All of Cook County |
|---|---|---|---|
| 1999 | 98,035 | 116,930 | 214,965 |
| 2010 | 215,111 | 157,306 | 372,417 |
| 2018 | 219,010 | 156,712 | 375,722 |
| 2025 | 218,828 | 153,526 | 372,354 |
Most of the boom was in Chicago’s townships. Their condo units more than doubled from 1999 to 2010, from 98,035 to 215,111; that gain of 117,076 is 74.4 percent of the county’s. By 2025 they held 218,828 units, 58.8 percent of the county’s condos.
| Township | Units, 1999 | Units, 2010 | Units, 2025 |
|---|---|---|---|
| Lake View (Chicago) | 34,771 | 57,262 | 57,789 |
| North Chicago (Chicago) | 28,615 | 47,951 | 47,756 |
| West Chicago (Chicago) | 4,898 | 29,533 | 33,351 |
| South Chicago (Chicago) | 6,063 | 26,143 | 27,473 |
| Jefferson (Chicago) | 8,723 | 22,937 | 23,172 |
| Wheeling | 15,157 | 18,069 | 17,857 |
| Hyde Park (Chicago) | 6,943 | 15,487 | 14,267 |
| Schaumburg | 12,448 | 13,741 | 13,385 |
| Maine | 9,077 | 11,968 | 11,738 |
| Palatine | 8,863 | 12,418 | 11,705 |
Lake View township had the most condos in 1999 and still does, 57,789. West Chicago township grew the most relative to where it started among these ten: from 4,898 units in 1999 to 29,533 in 2010 and 33,351 in 2025, still rising after the county’s count leveled off. South Chicago township went from 6,063 to 27,473. Hyde Park township moved the other way after 2010, from 15,487 units to 14,267.
When the buildings went up
| Decade built | Condo units, 2025 | Share |
|---|---|---|
| Before 1900 | 7,993 | 2.1% |
| 1900s | 8,805 | 2.4% |
| 1910s | 17,039 | 4.6% |
| 1920s | 24,063 | 6.5% |
| 1930s | 6,633 | 1.8% |
| 1940s | 3,867 | 1.0% |
| 1950s | 11,028 | 3.0% |
| 1960s | 39,218 | 10.5% |
| 1970s | 80,461 | 21.6% |
| 1980s | 45,624 | 12.3% |
| 1990s | 43,978 | 11.8% |
| 2000s | 71,366 | 19.2% |
| 2010s | 7,280 | 2.0% |
| 2020 to 2025 | 4,999 | 1.3% |
Buildings from the 1970s hold the most condo units, 80,461, or 21.6 percent, followed by the 2000s with 71,366. Buildings built from 2010 through 2025 hold 12,279, 3.3 percent — sixteen years of new construction, set against the 71,366 of the 2000s’ ten.
What the file confirms, and what it cannot tell you
Confirmed, as recorded: how many condominium parcels the assessor lists each tax year, by township, flag and year built. The file says parking, storage and common-area parcels are challenging to identify and that the assessor is still cleaning those records up, so some parcels counted here as units may be parking or storage, and the reverse; flagged parking and storage parcels rose by 2,342 from 2010 to 2025, and that cleanup could account for part of the decline in older buildings. Not shown: which buildings converted, deconverted or came down, and why; anything about owners or occupants; and whether a unit is lived in. This analysis used only grouped counts, never a parcel number or an address.
Where the record lives
The Residential Condominium Unit Characteristics file and the current-year Parcel Universe, which supplied the township names, sit on Cook County’s data portal. Every figure here was computed from them as retrieved on September 18, 2026.
The bottom line
Cook County’s condo count grew 73.2 percent from 1999 to 2010 and has barely moved since, with new buildings and old ones offsetting each other. Nearly three in five of the county’s condo units now sit in Chicago’s townships.
Three questions the file can answer
How many condo units does Cook County have? 372,354 in the 2025 rows, not counting parking, storage or common areas. Which township has the most? Lake View, 57,789. Which decade’s buildings hold the most units? The 1970s’, with 80,461.
- Source: the Cook County Assessor’s Residential Condominium Unit Characteristics file (3r7i-mrz4), tax years 1999 through 2026, retrieved September 18, 2026.
- Units: rows not flagged as parking, storage or a common area.
- Read: grouped counts by tax year, township, flag and year built; no parcel number, address or owner field selected.
- Townships: names from the assessor’s current-year Parcel Universe (pabr-t5kh).
- Ours: reading the growth in units in pre-1999 buildings as conversions to condominiums.
Computed by KCM Desk from the Cook County Assessor’s Residential Condominium Unit Characteristics file, retrieved September 18, 2026. Human-guided and edited — about this desk. If you spot an error, corrections come first.
Related Keep Chicagoland Moving coverage
- Chicago Housing, by the Numbers
- Chicago’s Condo Deconversion Pattern: 69 Buildings Bought in Bulk Since 2018 Left the Tax Rolls as Condominiums, the Nearest Parcels Now Classed as Apartment Buildings or Two-to-Six-Flats
- Since 2008, Chicago’s Townships Lost 3,260 Houses and Small Apartment Buildings and the Suburbs Gained 6,351, by the Assessor’s Count
- Half of Cook County’s Houses and Small Apartment Buildings Date From 1954 or Earlier — and 2.2 Percent From 2010 or Later, by the Assessor’s Count
- Chicago Issued 698 New-Construction Permits in the First Half of 2026. Here’s Where They Went.
- What a Chicago Home Actually Sold For: 245,849 Deeds Since 2018, All 77 Community Areas