Which Bus Carries Chicago? The 9 Ashland Leads June 2026 — but Every Million-Ride Month in the File Belongs to the 79 79th

An articulated bus pulling away from a stop on a wide Chicago avenue

The CTA's route file read whole: 41,267 route-month rows since 2001. The 9 Ashland leads June 2026 at 549,149 rides - but all five million-ride months in the file's quarter century belong to the 79 79th, peaking at 1,058,879 in October 2008. Navy Pier's bus is the Saturday king, 58 route labels have gone quiet, and one is filed as 992 ROAD CALL. Rides per route, never systemwide totals.

Chicago’s Own Empty-Seats Ledger: 3,857 Vacancies on the August 31 Snapshot — and POLICE OFFICER Alone Accounts for 732

Rows of empty desks in a municipal office with tall windows

Chicago publishes its own empty-seats file monthly from its personnel system. The August 31 snapshot: 1,310 vacancy-carrying position lines, 3,857 vacancies beside 22,464 filled seats on those same lines - POLICE OFFICER alone at 732, one fire-recruit line at 166, and two-thirds of the file one empty chair at a time. No citywide rate, because the file lists only lines with vacancies - a boundary this page keeps on every number.

Which L Stop Logs the Most Entries? Clark/Lake Leads June 2026 — and One Station’s Saturday Average Has Beaten Its Weekday Average in 214 Months

A train arriving at an elevated Chicago L platform with downtown towers behind

The CTA's station-entries file read whole: 43,654 station-month rows since 2001. Clark/Lake leads June 2026, the ten busiest stops take a quarter of the month's 10.8 million entries, Cermak-Chinatown's Saturday average beats its weekday average for the 214th-plus time, the all-time top five all belong to one station label - and four station IDs simply stop appearing. Entries, never systemwide boardings; every label as filed.

Chicago Reads Its Sewers Weekly: Four Viruses, Seven Sites, 237 Weeks — and Every Virus Sat at Minimal in the Newest Week on the File

A manhole cover in a sunlit brick-paved street

Since February 2022 Chicago has measured respiratory viruses in its sewers at seven sewershed sites, weekly. Read whole - 6,692 rows, 237 weeks - the file shows four very different ledgers: SARS-CoV-2 with 51 Very High weeks, Influenza B with exactly one, RSV peaking the week that straddled New Year 2024 - and every virus at Minimal in the newest week. Concentrations, never illness counts; every caveat quoted from the file itself.

When Does the Street Sweeper Come? Chicago’s 2026 Schedule Holds 8,545 Section-Sweep Dates, 2,721 Still Ahead — and Two Sections Booked 66 Times

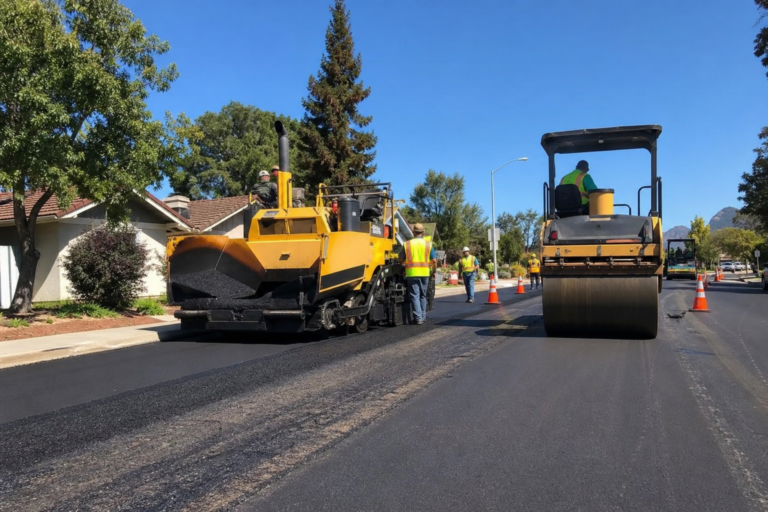
A street sweeper brushing along the curb of a Chicago residential street

When does the sweeper come? Chicago publishes the 2026 answer as a file: 837 ward sections, 8,545 scheduled section-sweep dates from April 1 to November 20 - 2,721 still ahead as of September 7. The median section carries ten dates, two Ward 2 sections carry 66, and the city's own side-of-street convention explains the two-date months. A decision-guide read: what the schedule confirms, what it can't, and where the lookup lives.

Chicago’s Vehicle-Inspection Lane: 38,647 Appointments for 5,330 Cabs, Liveries and Ambulances, a 34 Percent FAILED Share — and One Taxi Booked for 2098

A taxi raised on a lift in a municipal inspection garage bay

Chicago's for-hire inspection lane, read whole: 38,647 appointments for 5,330 taxis, liveries and city-licensed ambulances since 2023 - 7.3 bookings per vehicle, a 34 percent FAILED share of decided results, liveries at 44.8 percent, ambulances at 18.4, one taxi with 30 appointments, three filed under CHANGE_COLOR - and one RETEST on the books for July 15, 2098, marked PASSED, printed as filed.

What Chicago’s TIF Deals Promise, and What Their Reports Show So Far: 1,688 Jobs Projected on the 2025 Reports, 543 in the Actual Column

A mid-rise building under construction on a Chicago commercial street

The TIF annual reports now publish a deal-by-deal jobs scorecard: projections beside actuals for every subsidized redevelopment agreement. Read whole - 110 rows, 2022-2025 - the 2025 reports project 1,688 permanent jobs with 543 in the actual column so far, one agreement promised 70 jobs and reports 130, another promised zero and reports 59, and one projection reads exactly 2.5 jobs, printed as filed. Snapshots, not verdicts - and the file cuts both ways.

Chicago Measures Its Own Air Now: 286 Sensors, 2,544,089 Hourly Readings — and 96 Percent of Its 100-Plus PM2.5 Hours Landed on Two July Dates

An air-quality sensor mounted on a light pole on a hazy Chicago street

Chicago runs its own air-sensor network now: 286 sensors carrying all 77 community-area names, 2,544,089 hourly readings since July 2025, read whole. The PM2.5 record book belongs to two UTC dates - July 16 and 17, 2026, with a 486.8 microgram hour and 96 percent of every 100-plus sensor-hour ever logged - beside an ordinary record where such hours are 0.45 percent of everything. Not for regulatory purposes, says the file itself, and this page keeps every caveat.

8 Chicago Height Records, by the Record: The City That Raised Its Streets, a Footprint File Where Two Stories Is King — and a Stories Column That Tops Out at 110

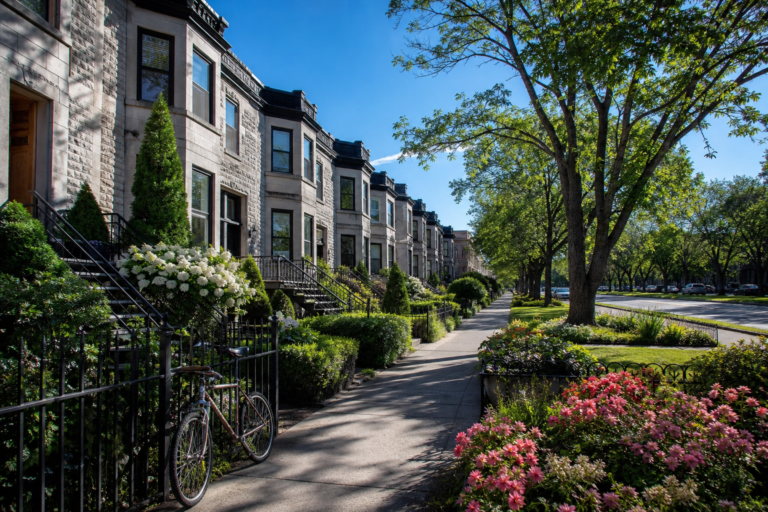
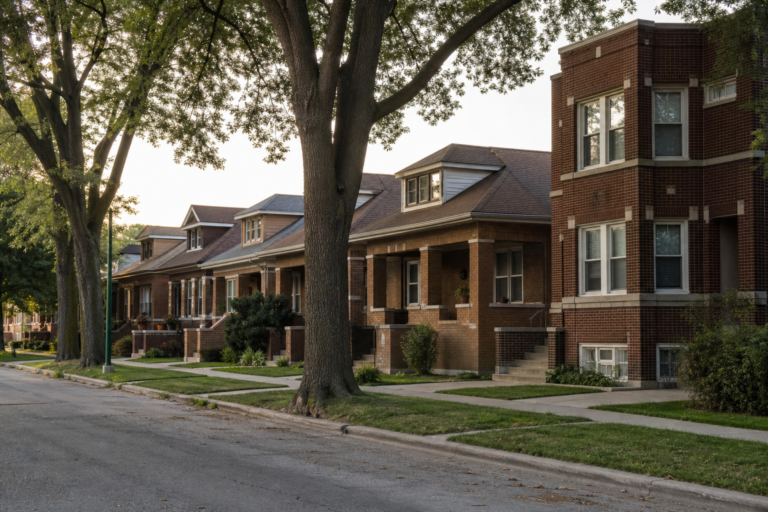
Brick two-flats in the foreground with the Chicago skyline rising behind

Chicago's height story, with receipts: the streets themselves were raised four to five feet on average in the 1850s, a building among the world's first skyscrapers went up - and came down - at LaSalle and Adams, the Willis Tower held the world title for nearly 25 years, and the city's own footprint file crowns a different king: two stories, 198,439 times. Eight vertical records, every one traceable.

Does Chicago’s Alt-Fuel File Mean a Plug Is Always Near? 350 Public Electric Stations, Just 291 Fast Ports — and the Columns That Decide

An electric car plugged into a public charging station on a Chicago street at dusk

Chicago's alternative-fuel file lists 398 stations, and the short answer is direct: 350 public electric stations marked Available, 283 of them posted 24 hours. The longer answer lives in the columns - 1,043 Level 2 ports against just 291 fast ports, 26 network labels, four ZIP codes holding 38 percent of everything, and a last-confirmed date on nearly every row. A decision-guide read of the whole file.

Moving HereLiving HereCity in MotionNeighborhoods & Suburbs
About · Editorial Policy · Our Data & Methods · Privacy · Terms · Contact
© 2026 Keep Chicagoland Moving · A TAK Marketing, LLC publication · Part of the fabulous Omnishun information systems