Chicago’s Procurement Department Took 40.9 Days on Average to Approve Task Orders So Far in 2026, More Than Six Times 2023’s 6.2 — Its Own Weekly File Lists a 14-Day Target

City work trucks and a street sweeper lined up in a fleet yard on a sunny morning

Chicago’s Department of Procurement Services took an average of 40.9 days to approve a task order request in 2026 through September 13, by this desk’s weighting of its weekly scoreboard - more than six times 2023’s 6.2 days. The file lists a 14-day target, and no week in 2025 averaged at or under it. Its City Auctions scoreboard passed its $2 million goal in May and reached $4.13 million. They are the last two of the data portal’s 52 Performance Metrics datasets still updated every week.

Chicago’s Health Department Has Published Five Alerts on an ‘Increase in Opioid Overdoses in Chicago’ in 2026 — Its Public Alert File Holds Three From All Earlier Years

The entrance of a community health center on a sunny morning

The Chicago Department of Public Health’s Health Alert Network file, all 1,835 alerts analyzed by date, title and label: five alerts in 2026 whose titles begin ‘Increase in Opioid Overdoses in Chicago,’ four of them since June 3, against three in all earlier years. COVID-19 and flu labels lead the file, this year’s count by September 14 is the lowest since its stated coverage began, measles titles bunch in 2019, 2024 and 2025, and the priority label’s use changed over time.

Chicago’s Vision Zero List Counts 101 Traffic Deaths in 2025, the Fewest of Any Year From 2019 Through 2025 — and 62 in 2026 Through July 29, Five More Than at That Date Last Year

A crosswalk with a lit walk signal at a sunny city intersection

The city’s Vision Zero traffic fatality list, read whole: 101 deaths in 2025, the fewest of any year from 2019 through 2025 and 45.7 percent below the 186 of 2021. By July 29, 2026 the list held 62, five more than at that date in 2025. Pedestrians are 354 of the 1,048 deaths on it, Austin has the most of any community area, and through mid-July 2026 it counts 52 more deaths than the city’s main crash file.

Lincoln Park Holds 1,590 of the 9,282 Properties Chicago’s Historic Survey Rated Red or Orange — About One in Six, While Four Community Areas Have None

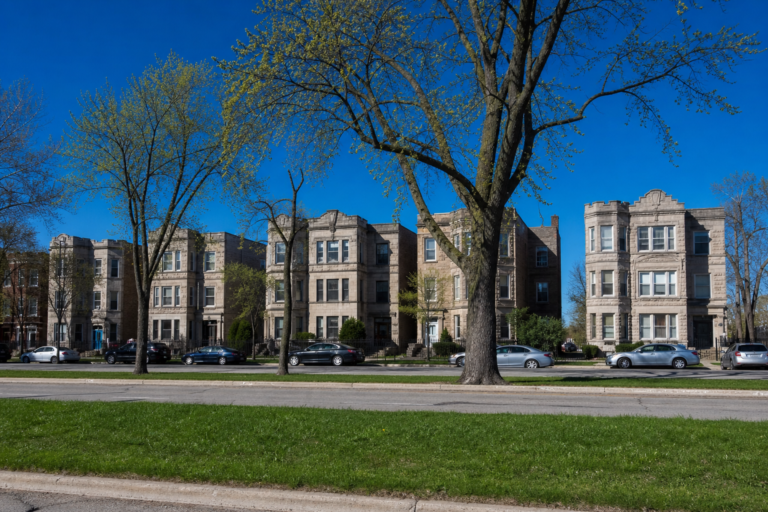
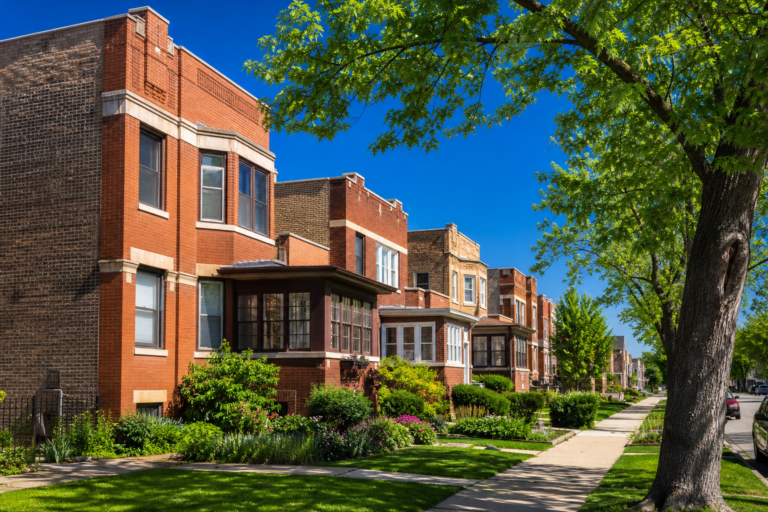
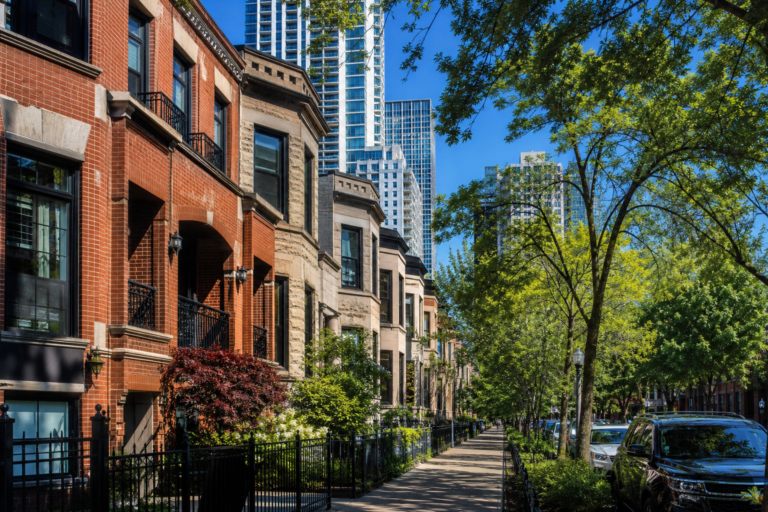
A row of late-1800s brick and greystone rowhouses with ornate cornices on a quiet street

The Chicago Historic Resources Survey file behind the city’s Demolition-Delay Ordinance, read whole and placed by community area: 9,282 properties rated red or orange, 1,590 of them in Lincoln Park and none in Burnside, Calumet Heights, Mount Greenwood or Riverdale. The Loop and Near North Side hold 80 of the 151 placed red-rated properties, 63.7 percent of dated rows were built before 1900, and the file’s demolished flag marks just four.

Chicago Had $205.3 Million Still Available at the End of May on 215 Grants That End This Year — $73.4 Million of It ARP Recovery Money Dated to December 31

A public library branch with a small plaza and flowering planters on a sunny day

The Office of Budget and Management’s Grants 925 file, read one snapshot at a time: on May 31, 2026 the city carried 509 active grants with $4.08 billion of budget, 75.2 percent spent. 215 grants ending before December 31 still showed $205.3 million available, $73.4 million of it on ARP Local Fiscal Recovery Fund rows - rows the file’s own description says would not be in it. The file stacks two snapshots, so its rows are never added together.

A Point of Illinois’ Income-Tax Share Was Worth $75.4 Million to Chicago in Fiscal 2025 — Out of $488.1 Million the City Received at 6.47 Percent

A small-town main street leading to a brick city hall on a bright summer day

Chicago received $488,086,064 from Illinois’ Local Government Distributive Fund in fiscal 2025 at a 6.47 percent share, by the city’s own file - 21.4 percent of what every local government got. A point of share was worth $75.4 million to the city and $352.0 million statewide. The file’s model, checked on all 19,559 rows, scales each year’s receipts to hypothetical shares of 7 to 11 percent and holds the state’s pool fixed.

Chicago Makes the Banks That Hold Its Money Report Their Lending. Four Files, 337,429 Rows — and Five Different Spellings of BMO.

A stone bank building on a sunny commercial corner

The four Lending Equity files the City Comptroller publishes under the Municipal Code, read together: 337,429 rows for 2021 through 2025, $113.59 billion of commercial and consumer lending, $35.44 billion of amounts on residential records, and reported account balances up to $84.04 billion a year. The files also carry 47 bank names for 20 institutions, one loan outcome in five forms, 1,491 blank outcomes, and a year in which one bank filed 88.6 percent of the account rows.

Chicago’s Record of Payments to Minority- and Women-Owned Firms on Procurement-Department Contracts Stops in March 2024 — and Its Last Period, at 24.7 Percent, Is the Lowest of the 18 in the File

A storefront under renovation with a contractor's van on a sunny street

The city’s quarterly record of payments to certified minority- and women-owned firms, read whole: $7,437,695,599 paid on Department of Procurement Services contracts across 18 reporting periods, $2,634,584,486 of it — 35.4 percent — to MBE and WBE firms. The share crossed 40 percent in four periods and ends at 24.7 percent in the first quarter of 2024, the lowest in the file; it has not been updated in 763 days.

Chicago’s 2026 Beach Sampling Season Ended September 7 With 57 of 1,898 Rapid-Test Readings Above the Advisory Level — 3.0 Percent, the Second-Lowest of Twelve Summers

A sunny lakefront beach with a lifeguard chair and colorful umbrellas

The Park District’s beach lab file, read whole after the season: 1,898 rapid water tests at 18 beaches between May 22 and September 7, 2026, of which 57 — 3.0 percent — came back above the 1,000 CCE level the file ties to a yellow swim advisory flag. That is the second-lowest share of the rapid test’s twelve summers, behind 2023. Humboldt had nine crossings in 73 tests; North Avenue none in 107.

Chicago’s Other Reimbursement File Is All Mileage: $24.0 Million Since 2005, Three-Quarters Fewer Payments Than in 2006, and a Third of It Against Inspector Titles

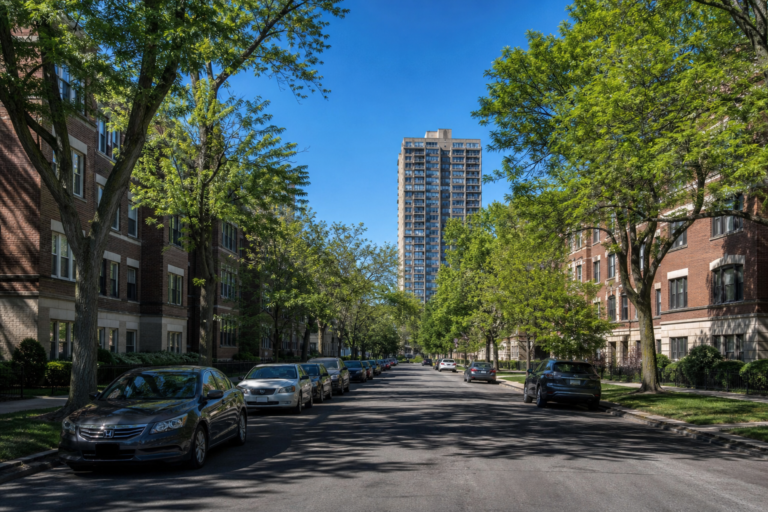
A white sedan driving down a sunny tree-lined boulevard

The city’s second reimbursement stream, read whole: 95,612 payments worth $23,966,486.16 between July 2005 and August 2026, every one of them filed as mileage. Payments fell from 9,976 in 2006 to 1,995 in 2022 and have since risen to 2,333, while the median payment grew from $243.86 to $315. Six departments hold 80.4 percent of the dollars and inspector titles a third; no employee is named, and the file records no miles or rate.

Moving HereLiving HereCity in MotionNeighborhoods & Suburbs
About · Editorial Policy · Our Data & Methods · Privacy · Terms · Contact
© 2026 Keep Chicagoland Moving · A TAK Marketing, LLC publication · Part of the fabulous Omnishun information systems