KCM Desk

KCM Desk

The KCM Desk is the research and editorial operation behind Keep Chicagoland Moving, a publication of TAK Marketing, LLC. It's a desk, not a person: coverage is produced through intensive Chicago-focused research across public data, agency documents, and local reporting, then reviewed and edited before it publishes. How we work, in detail: keepchicagolandmoving.com/methodology/

The Lowest Posted Clearance in Chicago’s Truck-Limit File Is 9 Feet 8 Inches — and One in Three Postings Sits Below 13 Feet 6

Low rail viaduct over a Chicago side street in warm light

The lowest posted street clearance in CDOT's truck-limit file is 9 feet 8 inches, at Melrose and Ravenswood - and the 1800 West block of Ravenswood holds three of the eight lowest postings. 1,713 posted height restrictions read in full: the fourteen lowest with ties shipped whole, one in three below 13 feet 6, and the Loop and Near West Side tied at 134 postings each. Posted signs, not measured steel - the file names no structures, and neither does this page.

The Busiest Chicago Public Library Branches, by 2025 Visits

Sunlit reading room with tall shelves in a Chicago library

The Harold Washington Library Center logged 953,677 visits in 2025 - about three times any other location - with Sulzer Regional the busiest branch outside the Loop at 310,522. The top ten locations by the library system's own door counts, each with its 2019 comparison; only two beat their pre-pandemic count.

Every Chicago Lakefront Beach, Ranked by Advisory-Level Water Tests

Clear water at a Chicago lakefront beach on a summer morning

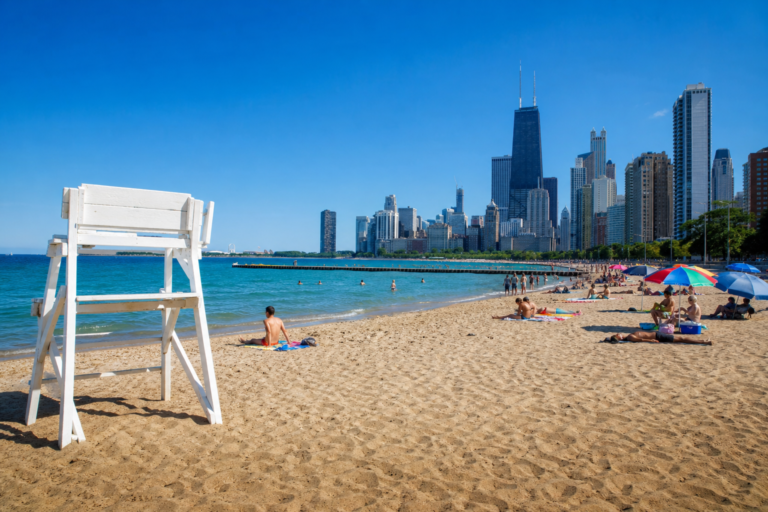
North Avenue Beach has the cleanest water-test record on Chicago's lakefront - 1.4 percent of its lab tests since 2021 at or above the swim-advisory action level - while 63rd Street sits at 10.3 percent, seven times that share. All 17 lakefront beaches ranked from the city's own 9,524 lab results, with Humboldt's inland lagoon counted apart.

The Chicago Lobbyists With the Most Reported Compensation in 2025

Steps and columns of a Chicago civic building at golden hour

No Chicago lobbyist reported receiving more in 2025 than Patrick Carey: $1,837,000 across his clients' quarterly filings, with John Dunn at $1,795,250 behind him. The ten registered filers with the most reported compensation, every figure summed as filed from the city's mandatory disclosure ledger - which records pay, not influence.

The Chicago TIF Districts With the Largest Fund Balances

Renovated industrial-corridor street with the skyline beyond

The Kinzie Industrial Corridor TIF holds $293 million - the largest special-fund balance of Chicago's 121 TIF districts - with LaSalle Central at $247.4 million behind it. The top ten funds hold $1.37 billion, 45 percent of the $3.05 billion across all districts, every figure from the districts' own 2024 annual reports.

The Chicago Community Areas With the Most Divvy Stations

Bike-share docking station on a leafy Chicago sidewalk

The Near West Side has more Divvy stations than any other Chicago community area - 91 in Divvy's own live feed - with the Near North Side at 90 and Lincoln Park at 76. The top ten areas ranked from the operator's feed, each entry showing the city dataset's count beside it, because the two official files sit 840 stations apart inside the city.

The Chicago Community Areas With the Most Registered Murals

Several colorful abstract murals painted along a brick alley wall

West Town has more registered murals than any other Chicago community area - 66 of the 458 on the city's own Mural Registry - with Uptown at 56 and the Loop at 54 behind it. The top ten areas, each count placed by the mural's own coordinates, and the registry-not-a-census rule that scopes every rank.

Divvy’s Live Feed Lists 2,048 Stations. Chicago’s Own Divvy Dataset Lists 1,197.

Bike-share bicycles docked in a row on a sunny Chicago sidewalk

Chicago's official Divvy-station dataset lists 1,197 stations with 20,100 docks; Divvy's own live feed, read the same week, lists 2,048 - and 2,009 of them sit inside the city's 77 community areas, 840 more than the city file places there. Both counted the same way, both dated, plus the archived feed's growth arc from 72 stations in July 2013 to 1,419 on its last day in 2022. Infrastructure only - the trips live in our ridership analysis.

Moving HereLiving HereCity in MotionNeighborhoods & Suburbs
About · Editorial Policy · Our Data & Methods · Privacy · Terms · Contact
© 2026 Keep Chicagoland Moving · A TAK Marketing, LLC publication · Part of the fabulous Omnishun information systems