KCM Desk

KCM Desk

The KCM Desk is the research and editorial operation behind Keep Chicagoland Moving, a publication of TAK Marketing, LLC. It's a desk, not a person: coverage is produced through intensive Chicago-focused research across public data, agency documents, and local reporting, then reviewed and edited before it publishes. How we work, in detail: keepchicagolandmoving.com/methodology/

The Chicago TIF Districts With the Largest Fund Balances

Renovated industrial-corridor street with the skyline beyond

The Kinzie Industrial Corridor TIF holds $293 million - the largest special-fund balance of Chicago's 121 TIF districts - with LaSalle Central at $247.4 million behind it. The top ten funds hold $1.37 billion, 45 percent of the $3.05 billion across all districts, every figure from the districts' own 2024 annual reports.

The Chicago Community Areas With the Most Divvy Stations

Bike-share docking station on a leafy Chicago sidewalk

The Near West Side has more Divvy stations than any other Chicago community area - 91 in Divvy's own live feed - with the Near North Side at 90 and Lincoln Park at 76. The top ten areas ranked from the operator's feed, each entry showing the city dataset's count beside it, because the two official files sit 840 stations apart inside the city.

The Chicago Community Areas With the Most Registered Murals

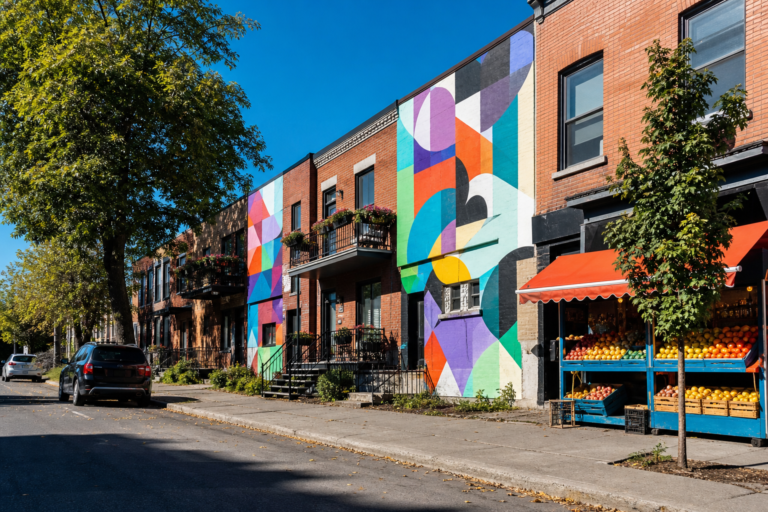
Several colorful abstract murals painted along a brick alley wall

West Town has more registered murals than any other Chicago community area - 66 of the 458 on the city's own Mural Registry - with Uptown at 56 and the Loop at 54 behind it. The top ten areas, each count placed by the mural's own coordinates, and the registry-not-a-census rule that scopes every rank.

Divvy’s Live Feed Lists 2,048 Stations. Chicago’s Own Divvy Dataset Lists 1,197.

Bike-share bicycles docked in a row on a sunny Chicago sidewalk

Chicago's official Divvy-station dataset lists 1,197 stations with 20,100 docks; Divvy's own live feed, read the same week, lists 2,048 - and 2,009 of them sit inside the city's 77 community areas, 840 more than the city file places there. Both counted the same way, both dated, plus the archived feed's growth arc from 72 stations in July 2013 to 1,419 on its last day in 2022. Infrastructure only - the trips live in our ridership analysis.

Chicago’s Mural Registry Lists 458 Works — and West Town, Uptown, and the Loop Hold 176 of Them

Colorful abstract mural on a brick wall in afternoon light

Chicago's own Mural Registry lists 458 works, and three community areas - West Town, Uptown, and the Loop - hold 176 of them. Install years run 1971 to 2024 with the busiest years in 2017 and 2019, 55 of 77 areas hold at least one, and the registry's own area column disagrees with its own coordinates on nearly half its rows - so every mural here is placed by its coordinates. The registry as recorded, mapped in full.

Police and Fire Hold 16,960 of Chicago’s 31,768 City Positions — More Than Half the Roster

Row of varied city work vehicles in warm morning light

Chicago's own employee file lists 31,768 positions across 39 departments, and more than half sit in just two: police (12,181) and fire (4,779). The most common job title in city government is Police Officer - 24.7 percent of the entire roster. Salaried and hourly are different rosters, part-time barely exists, and one corner of the file is listed at $4.73 an hour. Counted from the roster as published, with no employee named.

Chicago Has Waived Nearly Two-Thirds of Its Calculated Filming-Permit Fees Since 2021 — $5.66 Million of $8.78 Million

Film production trucks and cones along a Chicago street

Chicago publishes every CDOT filming-permit application as data — 26,307 since 2013 — and the fee columns tell the sharper story: $8.78 million in calculated fees on 2021–2026 applications, $5.66 million of it waived, with no reason recorded in the file. The volume arc, the fee regimes, and the streets where the location rows cluster, counted at the grain the file actually uses.

Chicago’s TIF Funds Held $3.05 Billion in the 2024 Reports — More Than Double 2017, in Fewer Districts

Renovated brick loft buildings along a Chicago industrial corridor

Chicago’s 121 TIF districts ended the 2024 report year holding $3.05 billion in their special funds — more than double the 2017 reports’ $1.42 billion, in a roster that shrank from 144 districts. The year’s $1.25 billion increment against $515 million in itemized spending, the biggest funds ranked, and the transit TIF’s $70 million — all from the reports’ own figures.

Moving HereLiving HereCity in MotionNeighborhoods & Suburbs
About · Editorial Policy · Our Data & Methods · Privacy · Terms · Contact
© 2026 Keep Chicagoland Moving · A TAK Marketing, LLC publication · Part of the fabulous Omnishun information systems