
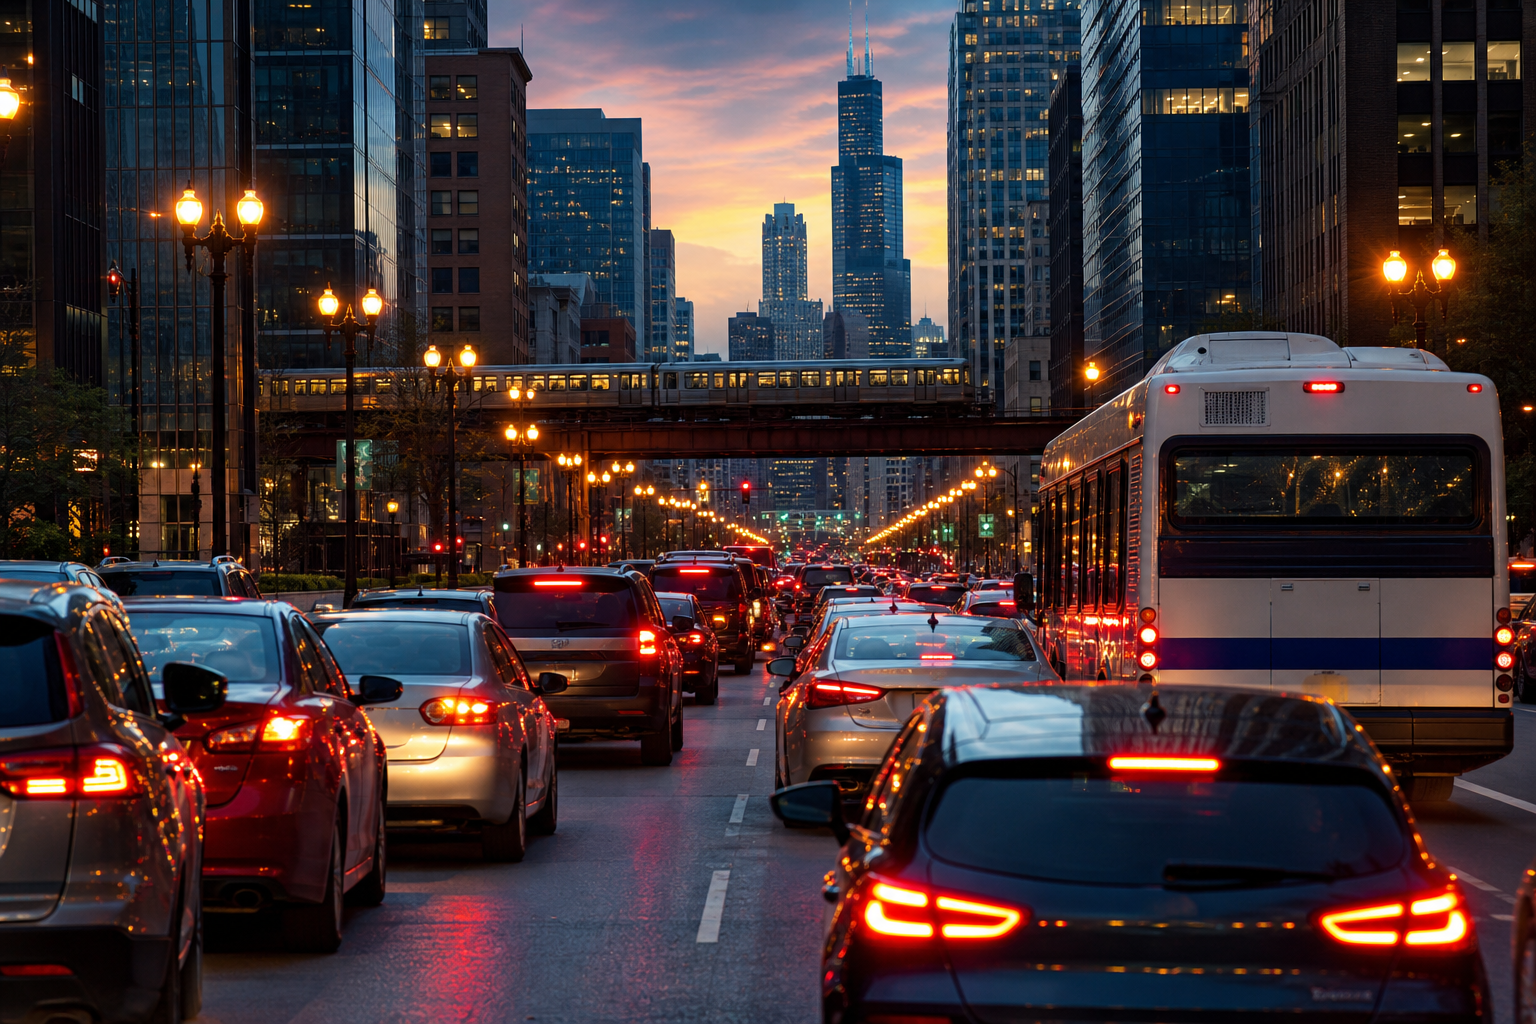

For eight years Chicago ran a public speedometer on its own surface streets. The Traffic Tracker — whose archive the portal now marks “This dataset is no longer updated” — logged an estimated speed for each of 29 arterial regions every few minutes, 10,776,684 region-interval rows from March 9, 2018 to April 30, 2026. The estimates come from an elegant trick the city’s own documentation describes: the tracker “estimates traffic congestion on Chicago’s arterial streets (non-freeway streets) in real-time by continuously monitoring and analyzing GPS traces received from Chicago Transit Authority (CTA) buses” — the buses are the probes. Read whole, the archive says: the fastest hour on Chicago’s arterials is 3 a.m. (a 30.85 mph average estimate in 2025) and the slowest are the 4 and 5 p.m. hours, tied at 23.33; the slowest region is the Chicago Loop (19.38) and the fastest is Riverdale-Hegewisch (33.41); and the single most congested cell in the 2025 table is the Loop at 5 p.m., where the average estimate is 13.9 miles per hour. Every figure on this page is an average of the tracker’s estimates — not a measurement of any driver’s speed.
Chicago Traffic Tracker – Historical Congestion Estimates by Region (kf7e-cur8), 10,776,684 region-interval rows, March 9, 2018 – April 30, 2026, 29 regions · retrieved August 27, 2026; the portal marks the file no longer updated · averages exclude the 896,315 rows carrying a zero estimate, which are counted separately belowA speedometer made of buses
The Chicago Transit Authority is a separate agency, but its buses doubled as the city’s traffic sensors: per the portal, the tracker estimated congestion by analyzing the GPS traces the buses sent. That mechanism shapes what the file can see. 8.3 percent of all rows carry a zero estimate, and they concentrate overnight: in 2025, 56.9 percent of 2 a.m. intervals record a zero. The file does not define what a zero means; our reading, labeled as ours, is that the zeros track the hours when few buses are out to serve as probes — and whatever their cause, they are not speeds. This page therefore averages only the rows with a positive estimate and counts the zeros apart, with no other trimming — which also means the file’s highest single estimate, 173.86 mph, stays in the data as filed, one implausible row among ten million absorbed by the averages.
The clock: 3 a.m. is 7.5 mph faster than 4 p.m.
| Hour (2025) | Avg. estimate, mph |
|---|---|
| 3 | 30.85 |
| 5 | 27.23 |
| 7 | 25.06 |
| 8 | 24.84 |
| 10 | 25.47 |
| 12 | 24.89 |
| 14 | 24.34 |
| 16 | 23.33 |
| 17 | 23.33 |
| 19 | 24.70 |
| 21 | 25.48 |
| 23 | 26.47 |
The spread widens where the city is densest. In the Chicago Loop in 2025, the average estimate at 3 a.m. was 27.02 mph; at 5 p.m. it was 13.9 — the arterial grid’s slowest hour-region cell, about three-fifths of the citywide 5 p.m. average of 23.33. Is downtown at rush hour really the slowest place and hour the tracker saw? By this file’s estimates, yes — it is the lowest average estimate in the 2025 table.
The map: a 14 mph spread across 29 regions
| Region (label as printed) | Avg. estimate 2025, mph |
|---|---|
| Chicago Loop | 19.38 |
| Near North | 20.91 |
| Edge Water-Uptown | 21.53 |
| Lincoln Park-Lake View | 22.35 |
| Rogers Park – West Ridge | 23.24 |
| … | … |
| South Deering-East Side | 29.10 |
| Ashburn | 29.70 |
| Beverly-Mt Greenwood-Morgan Park | 30.14 |
| Midway-Garfield Rdg-Clearing | 30.55 |
| Riverdale-Hegewisch | 33.41 |
The pattern is the city’s shape: the slow end of the table is the dense North lakefront and downtown — the Loop, Near North, the region the file labels “Edge Water-Uptown” — and the fast end is the far South and Southwest Sides, led by Riverdale-Hegewisch. The tracker records estimates, not explanations; density, signals, and bus routing all live inside these numbers somewhere, and the file does not say in what shares.
The years: the needle barely moves
| Year | Avg. estimate, mph | Positive-estimate rows |
|---|---|---|
| 2018 (from Mar. 9) | 24.22 | 1,059,964 |
| 2019 | 25.75 | 1,262,090 |
| 2020 | 26.02 | 1,300,135 |
| 2021 | 26.08 | 1,195,392 |
| 2022 | 26.21 | 1,167,736 |
| 2023 | 26.30 | 1,062,080 |
| 2024 | 25.67 | 1,016,598 |
| 2025 | 25.53 | 1,374,810 |
| 2026 (Jan–Apr) | 24.99 | 441,564 |
Across the seven full years the annual average moves inside a band 0.77 mph wide — from 25.53 in 2025 to 26.30 in 2023 — and this page draws no trend from it. The starkest comparison in the file is also its quietest: April 2020’s average estimate, 26.27 mph, runs just 0.62 mph above April 2019’s 25.65. Whatever that month emptied elsewhere, the arterial estimates barely registered it — why, the file does not say, and we leave it open.
- Source: the city’s Chicago Traffic Tracker – Historical Congestion Estimates by Region, 2018–2026 (kf7e-cur8): 10,776,684 rows, one per region per estimation interval, March 9, 2018 through April 30, 2026, for 29 arterial regions; retrieved August 27, 2026. The portal marks the file “no longer updated”; this page reads the archive as it stands. All figures were computed on the portal; no row-level file was downloaded.
- Unit: every figure is an average of the tracker’s region-interval speed estimates, in miles per hour. An estimate is not a measurement of any vehicle’s speed, and no figure here describes an individual driver.
- Mechanism: per the portal’s own description, the tracker “estimates traffic congestion on Chicago’s arterial streets (non-freeway streets) in real-time by continuously monitoring and analyzing GPS traces received from Chicago Transit Authority (CTA) buses.” The Chicago Transit Authority is a separate agency; its buses served as the probes.
- Zeros and oddities: 896,315 rows (8.3 percent) carry a zero estimate and are excluded from every average and counted here instead; they concentrate overnight (56.9 percent of 2 a.m. intervals in 2025) — our reading ties that to the hours when few buses are out, and the file itself does not define a zero. No other filtering or trimming was applied; the file’s maximum single estimate, 173.86 mph, is printed as filed.
- Partial years: 2018 begins March 9 and 2026 ends April 30; both are labeled wherever they appear. No trend is claimed from the annual averages.
Computed by KCM Desk from the city’s Traffic Tracker archive, retrieved August 27, 2026. Human-guided and edited — about this desk. If you spot an error, corrections come first.
Related Keep Chicagoland Moving coverage
- How Chicago Works, by the Numbers
- Chicago’s Crashes Peak at 3 p.m. The Odds of Dying in One Peak at 3 a.m.
- In June 2026, a Chicago Taxi Mile Cost $4.17 and a Rideshare Mile $4.21 — and the Fare Dollar Split Opposite Ways
- The CTA’s Own Daily Ledger: 11.06 Billion Boardings Since 2001, a Two-Million-Ride Day in 2008 — and a Recovery the Bus Is Carrying