
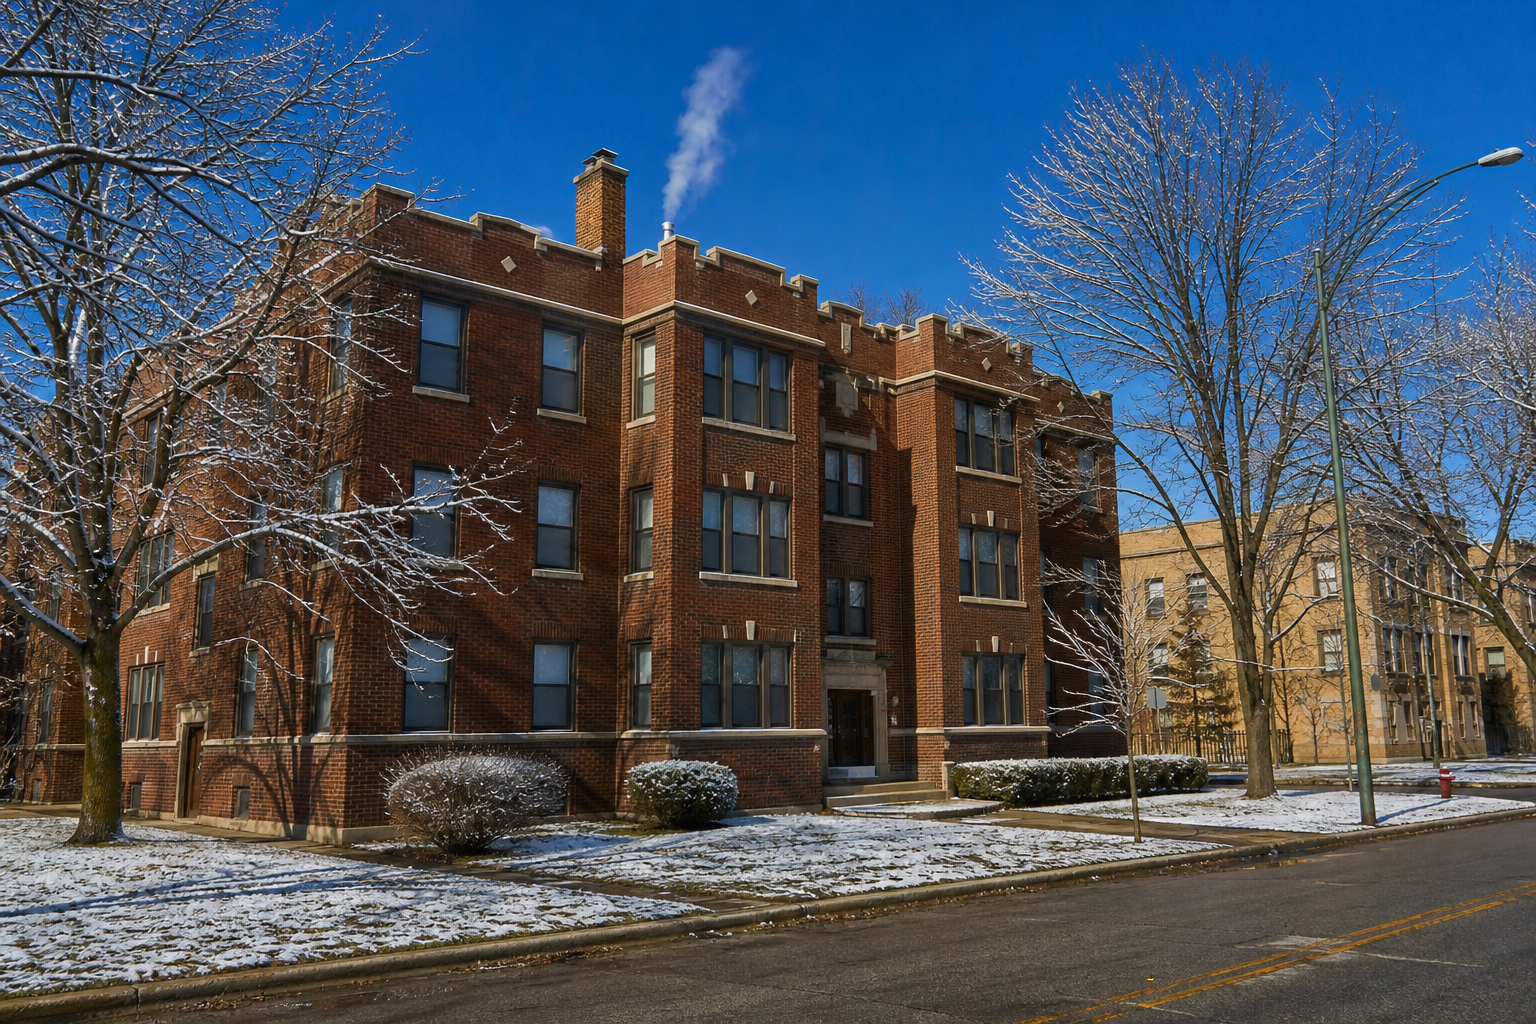

Chicago’s Department of Buildings cited 1,605 buildings for failing to heat homes adequately over the last five winters, 2021–22 through 2025–26, and South Shore had 169 of them: 55 for every 1,000 multi-unit residential buildings on its tax rolls, more than five times the citywide rate of 10. The heat season, when landlords must keep apartments with shared heat at 68 degrees by day and 66 at night, with a lower floor of 64 into October in buildings that heat and cool with one system, runs from September 15 to June 1, and the first citation of this winter was on file by October 7.
Department of Buildings violations (22u3-xenr) and the department’s heat-ordinance page, read October 7, 2026 · the season counts, area rates and matching are oursWhat the heat ordinance requires
| Question | What the Department of Buildings says |
|---|---|
| When | From September 15 until June 1, the “heat season” |
| How warm | In buildings with shared heat and no central cooling, at least 68°F from 8:30 a.m. to 10:30 p.m. and at least 66°F from 10:30 p.m. to 8:30 a.m. |
| Buildings that heat and cool with one system | At least 64°F at all hours from September 15 until the first night below 45°F outside or October 15, whichever comes first; then the same 68 and 66 as above |
| Where | All habitable spaces, toilet rooms and bathrooms; closets, hallways, storage areas and utility rooms have no set minimum |
| Who | Landlords supply heat where tenants lack their own controls, and keep tenants’ own heating equipment working |
| Penalty | $500 to $1,000 per day, per violation |
| How to report | A complaint through 311; the department inspects. For immediate danger, 911 |
The rules above are summarized from the Department of Buildings’ heat-ordinance page, which also says the ordinance covers workspaces and that “the reason for lack of heat does not matter.”
How many buildings are cited each winter?
Fewer than in the past, and about the same number each winter lately. Heat citations fell from 1,940 in the winter of 2006–07 to between 359 and 480 a winter since 2019–20; last winter there were 395 citations at 329 buildings. Nearly all come from complaint inspections: 2,032 of the 2,033 citations of the last five winters. Does the fall mean fewer cold apartments? The record cannot say. A citation usually starts with a complaint and needs an inspection that finds the violation, so the count also moves with how often people call and how inspections are run. Our reading: the count measures confirmed heat violations, and says less about how many homes went cold.
When are they written?
In the cold months. Since 2006, January has the most heat citations of any month, 3,321, then December, 2,726, February, 2,186, and November, 2,108. October, when the first cold nights come, has 1,597.
Where are buildings cited?
On the South Side, mostly. Over the last five winters South Shore had the most buildings cited, 169, and the highest rate among the 58 community areas with at least 500 multi-unit buildings, 54.7 per 1,000. Hyde Park followed at 45.6 and Chatham at 39.7, and the eight highest rates are all in South Side areas: South Shore, Hyde Park, Chatham, Washington Park, West Pullman, Auburn Gresham, Greater Grand Crossing and Roseland. Citywide the rate is 10.1. Kenwood’s rate is higher still, 56.8, on 405 buildings, a small enough base that a few citations move it, which is why the comparison above starts at 500. Our reading: heat citations gather where multi-unit buildings and confirmed complaints meet, and South Shore’s rate stands apart even among its neighbors.
| Community area | Buildings cited, 2021–22 to 2025–26 | Multi-unit buildings, 2026 | Per 1,000 |
|---|---|---|---|
| Albany Park | 20 | 2,968 | 6.7 |
| Archer Heights | 3 | 868 | 3.5 |
| Armour Square | 1 | 920 | 1.1 |
| Ashburn | 6 | 355 | 16.9 |
| Auburn Gresham | 77 | 2,876 | 26.8 |
| Austin | 88 | 7,684 | 11.4 |
| Avalon Park | 5 | 257 | 19.5 |
| Avondale | 18 | 3,887 | 4.6 |
| Belmont Cragin | 25 | 4,531 | 5.5 |
| Beverly | 8 | 339 | 23.6 |
| Bridgeport | 9 | 3,223 | 2.8 |
| Brighton Park | 8 | 3,976 | 2.0 |
| Burnside | 2 | 116 | 17.2 |
| Calumet Heights | 7 | 501 | 14.0 |
| Chatham | 79 | 1,989 | 39.7 |
| Chicago Lawn | 56 | 2,807 | 19.9 |
| Clearing | 6 | 735 | 8.2 |
| Douglas | 15 | 444 | 33.8 |
| Dunning | 7 | 1,188 | 5.9 |
| East Garfield Park | 20 | 2,206 | 9.1 |
| East Side | 4 | 950 | 4.2 |
| Edgewater | 33 | 2,615 | 12.6 |
| Edison Park | 0 | 278 | 0.0 |
| Englewood | 56 | 2,842 | 19.7 |
| Forest Glen | 1 | 313 | 3.2 |
| Fuller Park | 3 | 274 | 10.9 |
| Gage Park | 5 | 1,796 | 2.8 |
| Garfield Ridge | 1 | 651 | 1.5 |
| Grand Boulevard | 29 | 1,617 | 17.9 |
| Greater Grand Crossing | 68 | 2,766 | 24.6 |
| Hegewisch | 1 | 375 | 2.7 |
| Hermosa | 5 | 1,634 | 3.1 |
| Humboldt Park | 15 | 5,010 | 3.0 |
| Hyde Park | 30 | 658 | 45.6 |
| Irving Park | 12 | 4,032 | 3.0 |
| Jefferson Park | 6 | 1,738 | 3.5 |
| Kenwood | 23 | 405 | 56.8 |
| Lake View | 37 | 5,777 | 6.4 |
| Lincoln Park | 17 | 3,686 | 4.6 |
| Lincoln Square | 15 | 3,170 | 4.7 |
| Logan Square | 24 | 7,101 | 3.4 |
| Loop | 7 | 242 | 28.9 |
| Lower West Side | 3 | 3,824 | 0.8 |
| McKinley Park | 6 | 1,433 | 4.2 |
| Montclare | 4 | 506 | 7.9 |
| Morgan Park | 10 | 360 | 27.8 |
| Mount Greenwood | 3 | 112 | 26.8 |
| Near North Side | 14 | 1,429 | 9.8 |
| Near South Side | 5 | 267 | 18.7 |
| Near West Side | 15 | 2,560 | 5.9 |
| New City | 26 | 4,214 | 6.2 |
| North Center | 6 | 3,152 | 1.9 |
| North Lawndale | 54 | 3,795 | 14.2 |
| North Park | 6 | 816 | 7.3 |
| Norwood Park | 4 | 984 | 4.1 |
| Oakland | 9 | 264 | 34.1 |
| O’Hare | 3 | 565 | 5.3 |
| Portage Park | 14 | 4,072 | 3.4 |
| Pullman | 3 | 234 | 12.8 |
| Riverdale | 6 | 21 | 285.7 |
| Rogers Park | 32 | 2,132 | 15.0 |
| Roseland | 41 | 1,683 | 24.4 |
| South Chicago | 42 | 2,638 | 15.9 |
| South Deering | 10 | 374 | 26.7 |
| South Lawndale | 20 | 5,758 | 3.5 |
| South Shore | 169 | 3,092 | 54.7 |
| Uptown | 20 | 2,021 | 9.9 |
| Washington Heights | 14 | 601 | 23.3 |
| Washington Park | 25 | 718 | 34.8 |
| West Elsdon | 1 | 471 | 2.1 |
| West Englewood | 44 | 2,176 | 20.2 |
| West Garfield Park | 25 | 2,015 | 12.4 |
| West Lawn | 6 | 731 | 8.2 |
| West Pullman | 27 | 1,001 | 27.0 |
| West Ridge | 34 | 3,733 | 9.1 |
| West Town | 14 | 9,519 | 1.5 |
| Woodlawn | 38 | 2,142 | 17.7 |
What happens after a citation?
The record often does not say. Of last winter’s 395 citations, 281 are still marked open in the file, 113 complied and one is marked no entry. Where the file records compliance, it came a median of 34 days after the citation, and within 30 days in 48 of the 113 cases. The file does not say why a citation stays open, and an open citation does not show that the heat stayed off.
Are the same buildings cited again?
Some are. Of the 3,343 buildings cited in the last ten winters, 2016–17 through 2025–26, 264 were cited in two or more winters and 26 in three or more.
Known limits
Nearly every citation records a complaint that an inspector found to be a violation; apartments that were cold without a complaint, or without a finding, are not in the file. A building cited is an address as the file writes it. The rate counts those against multi-unit residential buildings on the 2026 tax rolls: two-to-six-flats, mixed-use buildings with apartments and apartment buildings, one parcel each, and condominium buildings counted once each. A large building counts as much as a small one, and houses, where the ordinance can also apply, are left out. Workspace heat citations are left out. No address, building or owner is named here.
- Citations Building Violations (22u3-xenr), read October 7, 2026: codes CN132016 (heat unit adequately), CN132026 (heat habitable room), CN100001 (no heat, residential) and CN100002 (insufficient heat, residential), every year since 2006. A citation dated September 15 through May 31 belongs to that winter’s heat season, which the ordinance sets as September 15 until June 1; the 50 citations written in summer are left out.
- Areas Each citation placed in a community area by its coordinates against the city’s community-area boundaries. The multi-unit building count comes from the Assessor’s 2026 Parcel Universe: each parcel in classes 211 and 212 and the 300 classes except 399 counts as one building, and each condominium building, classes 299 and 399, counts once by the first ten digits of its parcel numbers.
- Rules The Department of Buildings’ heat-ordinance page, read the same day; each sentence summarized was checked against it.
Computed by KCM Desk from records read October 7, 2026. Nothing here is legal advice. Human-guided and edited — about this desk. If you spot an error, corrections come first.
Related Keep Chicagoland Moving coverage
- Chicago Housing, by the Numbers
- How Chicago Works, by the Numbers
- A Chicago 311 Garbage-Cart Request Took a Median 15.9 Days to Close, a Pothole 5.8 and a Traffic-Signal-Out Report 3 Hours: 883,837 Requests Timed by Community Area
- Chicago’s Two Renter Ordinances, Side by Side: Neither Text Before the Council Requires Just Cause. They Differ on Fees, Deposits and the Registry.
- South Shore, by the Numbers: Two of Five Market Signals Active, the Median Condominium Up From $52,750 to $97,650, and House Prices Up 74 Percent
- Chatham, by the Numbers: Companies Bought 34.6 Percent of the Homes Sold in 2024–25, Up From 27.7 Percent, While First-Time Business Licenses Fell From 65 to 37
- Washington Park, by the Numbers: The Median Two-to-Six-Flat Rose From $215,000 to $562,500, the Fourth-Largest Rise in Chicago, and Companies Bought 35.1 Percent of Homes