
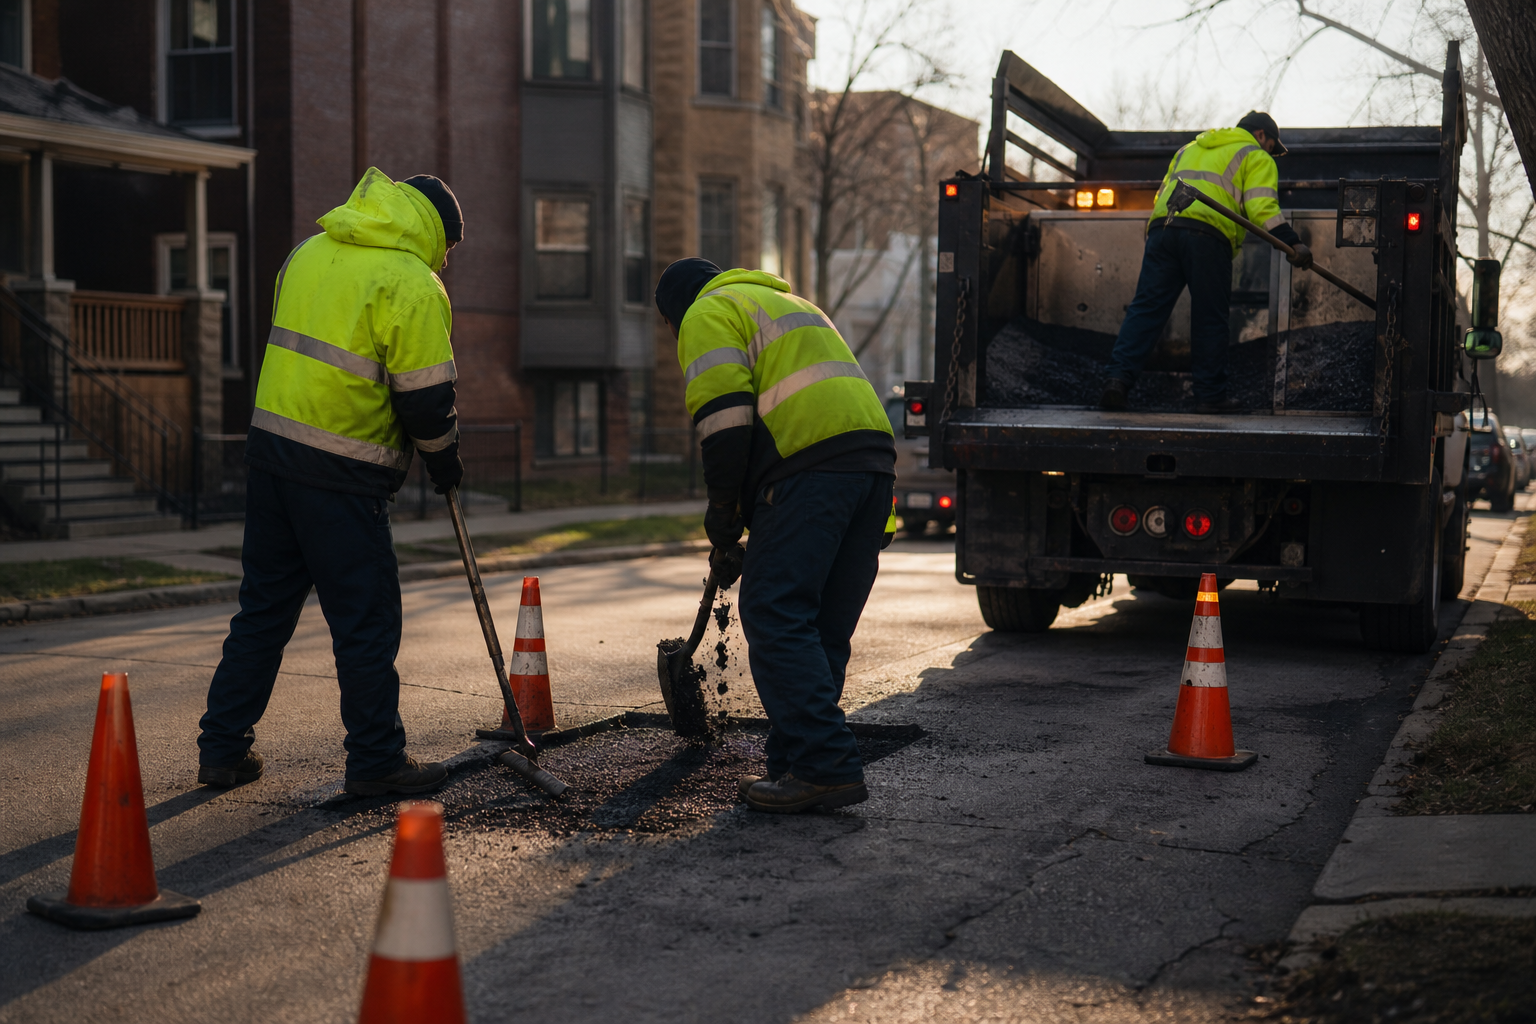

Chicago closed the median traffic-signal-out request in 3 hours and the median request to repair a garbage cart in 15.9 days, across 883,837 requests for eight street-level services filed with 311 from January 2024 through mid-June 2026. The slowest service got slower: garbage-cart requests filed in 2025 took a median of 23.7 days to close, about twice the 12.0 days of 2024. Potholes vary most by place, from under a day in the Loop to 26 days in Hermosa.
City of Chicago 311 Service Requests (v6vf-nfxy) · requests created January 1, 2024 through June 15, 2026, pulled October 1, 2026 · times are the city’s own timestamps; medians computed by usUpdated October 1, 2026: this page first timed requests filed through March 2026, pulled July 18, 2026. This reading adds requests filed through June 15, 2026, splits the clock by the year a request was filed and replaces the page’s earlier title and wording.
How the clock works
Every 311 request in the city’s service-request file carries the time it was created and, once the city marks the request closed, the time it was closed. This page measures the gap for eight services where a crew goes out to a fixed place: traffic signals, graffiti, street lights, rodent baiting, potholes, tree debris, abandoned vehicles and garbage carts. Requests the city marked as duplicates are left out. Every request counted was filed at least three and a half months before the pull, longer than any service’s median. The requests still open on October 1, under 2 percent of each kind, count at their age so far; each had already waited longer than the median and 90th percentile this page gives for requests filed in the same year. When such a request closes, its time can only be longer, so it stays above those figures and they do not change. A closed request means the city marked it closed; the file does not record whether the work met the caller’s expectations.
Which services close fastest?
The median traffic-signal-out request was closed in 3 hours and the median graffiti request in 17 hours. Street lights (2.5 days) and rodent baiting (3.1 days) followed. Potholes took 5.8 days and tree debris 6.1 days. The two slowest were abandoned vehicles, 11.6 days, and broken garbage carts, 15.9 days. Every rodent-baiting request in the window is marked closed, which may reflect how that program closes its files.
Has the city gotten faster or slower?
| Service | Filed in 2024 | Filed in 2025 | Filed Jan.–mid-June 2026 |
|---|---|---|---|
| Traffic signal out | 4 hours | 2 hours | 3 hours |
| Graffiti removal | 17 hours | 18 hours | 5 hours |
| Street light out | 2.7 days | 2.2 days | 2.6 days |
| Rodent baiting | 4.0 days | 3.7 days | 1.8 days |
| Pothole in street | 4.5 days | 7.0 days | 6.0 days |
| Tree debris clean-up | 4.7 days | 7.3 days | 8.0 days |
| Abandoned vehicle | 11.7 days | 10.8 days | 12.9 days |
| Garbage cart repair | 12.0 days | 23.7 days | 15.6 days |
Some of each. Set requests filed in 2024 against those filed in January through mid-June 2026 and four services slowed while four sped up. Garbage carts moved the most: requests filed in 2024 closed in a median of 12.0 days, those filed in 2025 in 23.7 and those filed in January through mid-June 2026 in 15.6. Potholes went from 4.5 days to 7.0 and then 6.0, and tree debris got slower in each period, from 4.7 days to 8.0. Two services got faster in 2026: rodent baiting, from 4.0 days in 2024 to 1.8, and graffiti, from 17 hours to 5 hours. Traffic signals stayed between two and four hours. Our reading: 2025 was the slowest year for carts and potholes, and tree debris has slowed every year; the 2026 figures cover five and a half months of requests that had less time to close, so they are the least settled of the three.
Where do requests wait longest?
The services differ in where requests wait. Potholes have the widest spread: Hermosa’s median pothole request took 26 days to close, North Lawndale’s 19.8 and Humboldt Park’s 17, against 5.8 days citywide and under a day in the Loop. Hermosa’s median was 17 days when this page first read the file in July, on requests filed through March 31; with requests through June 15 added and the open ones aged to October 1, it is 26. Abandoned vehicles waited longest in Lincoln Park, 21.0 days, and Lake View, 19.8, against 3.7 in the Loop. Tree-debris requests waited longest on the South and Far South Sides, 13.2 days in West Pullman and more than ten in Englewood, Roseland, Auburn Gresham and Greater Grand Crossing, while Douglas, Kenwood and Grand Boulevard, also on the South Side, were among the fastest. Street lights were the most even: every area’s median fell between 1.7 and 4.1 days. The file records how long each request waited, and nothing about why.
How long is the long tail?
A median describes the typical request; the 90th percentile marks where the slowest tenth begins. For pothole requests filed in 2024, the slowest tenth took 110 days or longer to close, and for those filed in 2025, 96 days, the longest tail of the eight services. For abandoned vehicles filed in 2025 it was 61 days, and for garbage carts 48. These figures use only the two full years, because requests filed in 2026 have not had as long to close.
Why tree trimming is not on the list
Tree trimming is not among the eight. The city’s Bureau of Forestry says it moved to area trimming in spring 2023, which means crews “trim all trees in one geographic area at the same time,” and it directs emergency tree problems, such as a parkway tree blocking a street or resting on a car, to 311. With trimming scheduled by area, a request-by-request clock would not measure the same thing.
How to file and follow a request
Requests can be filed by calling 311 or through the city’s CHI 311 website and mobile app, which the city says can be used to create requests and check the status of existing ones. The medians above are the record of how long such requests have taken, by service and by community area; the lookup below shows them for any area with enough requests.
Look up a community area
Known limits
The clock is the city’s: a request is done when the city closes it, and medians under a day reflect closing within a day. The eight services were chosen because the task is similar wherever it happens; they are not all of 311. Community areas come from the file’s own field, and an area’s median is shown only where it has 30 or more requests of that kind, which every area meets for all eight services except Burnside (graffiti and traffic signals) and Riverdale (graffiti and rodent baiting). Nothing here measures the quality of the work or why any area runs fast or slow.
- Source City of Chicago 311 Service Requests (v6vf-nfxy), pulled October 1, 2026: every request of the eight types shown that the file does not mark as a duplicate, created January 1, 2024 through June 15, 2026, with the file’s own community-area field. The first reading, pulled July 18, 2026, covered requests created through March 31, 2026.
- The clock Days from a request’s creation to its closure in the city’s system. Requests still open on October 1, 2026 count at their age on that day, a floor. Medians and 90th percentiles are computed over all requests of a kind; by-year figures group requests by the year they were created.
- Areas Medians per community area, shown where an area has 30 or more requests of that kind.
Computed by KCM Desk from records pulled October 1, 2026. Human-guided and edited — about this desk. If you spot an error, corrections come first.
Related Keep Chicagoland Moving coverage
- How Chicago Works, by the Numbers
- Chicago Cited 1,605 Buildings for Inadequate Heat Over the Last Five Winters. South Shore Had 169, a Rate More Than Five Times the City’s
- Six Years On, Which 2019 Building Violations Are Marked Complied? A Quarter in Englewood, Two-Thirds on the Near North Side
- It Is Peak Rat Season in Chicago. The City’s Own Rat Ledger Tells a Better Story Than the Trophy.
- One Map, Three Chicagos: Where the City Builds, Opens, and Rides
- One Chicago Speed Camera Recorded 166,666 Violations in Its First Year. Here Is the Leaderboard.
- Chicago Housing, by the Numbers