
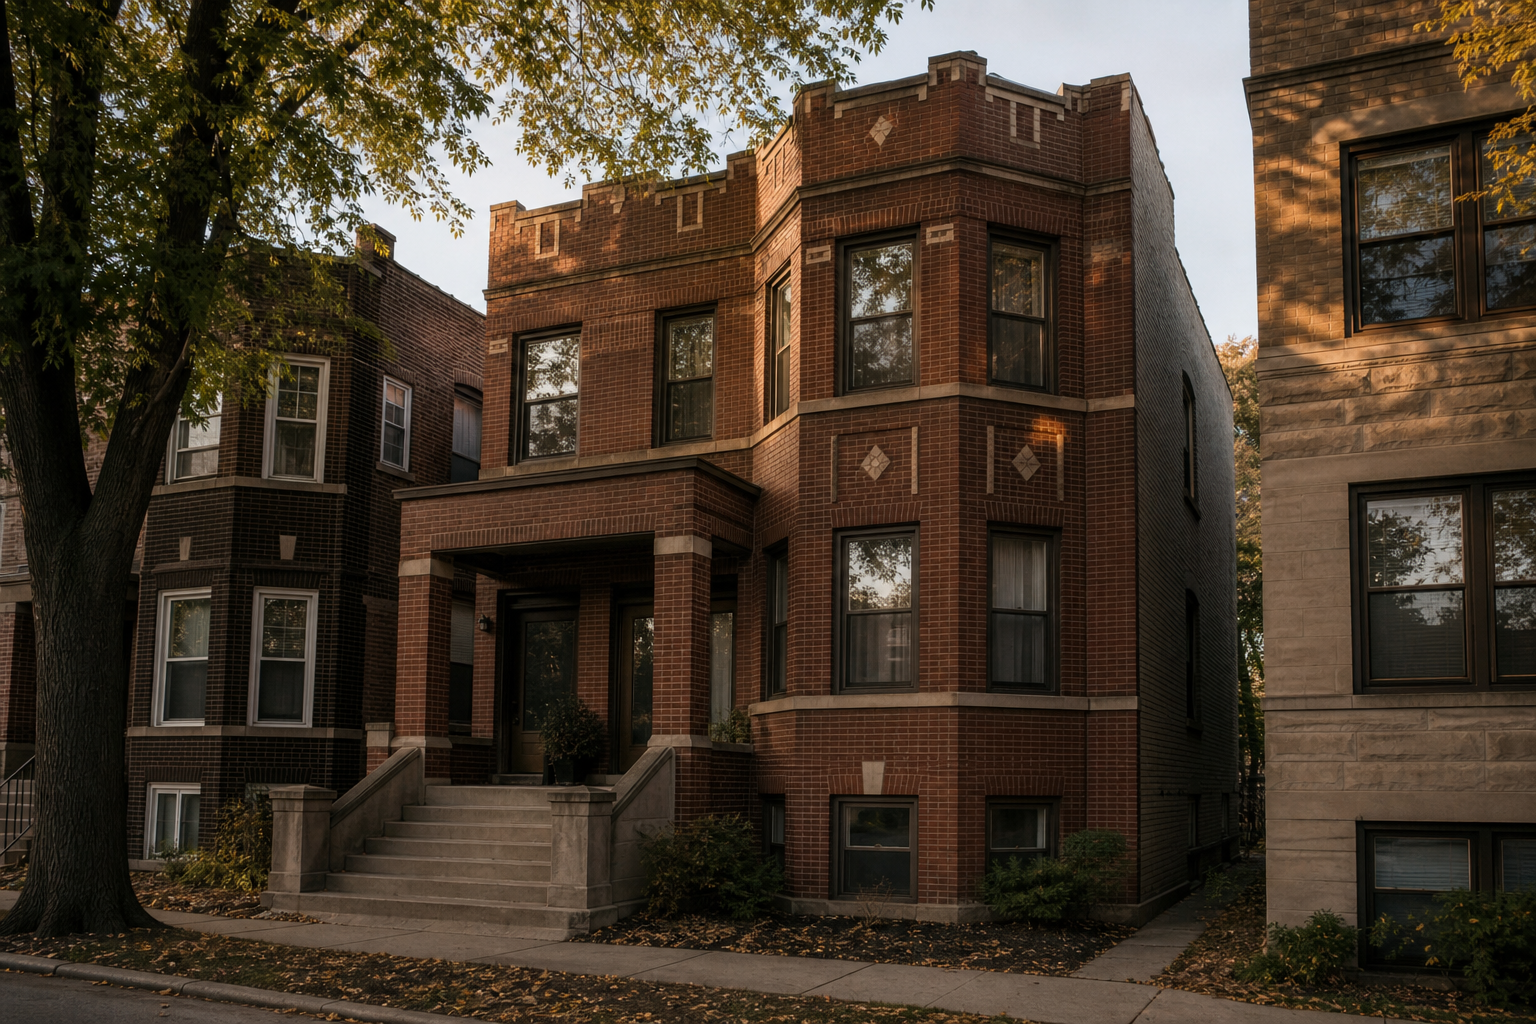

The median two-to-six-flat in Chicago, a small apartment building of two to six units, sold for $445,000 in 2025, 62 percent more than in 2019 and more than the median house ($320,000) or the median condo ($337,750). The largest percentage gains were where prices were lowest: in West Englewood the median house sale went from $40,000 to $152,500 over the same years.
A listing shows what a seller hopes for, and the popular price tools show estimates. This page is built from the deeds. We pulled 245,849 market sales of Chicago houses, condos, and small apartment buildings from the Cook County Assessor’s public sales file, covering January 2018 through July 14, 2026, and placed every sale in one of Chicago’s 77 community areas, the official statistical areas the city reports its numbers by. What follows is what buyers paid, community area by community area, with no modeling and no estimates.
Correction, September 30, 2026: when this page was first published on July 18, 2026, it said 19,720 homes changed hands in Chicago in 2025, the fewest of any year in this record and 36 percent below 2019. The county’s file had not finished with 2025. By its September 15, 2026 update it had added 5,502 more sales dated 2025, which brings the year to 25,222, more than 2024’s 25,064. Both of those totals are counted the way the July page counted them, with the parking and storage parcels described in the next note still included; the table further down leaves those out and shows 24,885 and 24,711. The 2025 count, the comparison with other years and every 2025 community-area figure on this page have been recomputed from the file as retrieved September 30, 2026. One error in the first version had nothing to do with the file: it named four community areas with a median house sale above $1 million when the data then showed six, leaving out the Near North Side and Uptown. All six are named below.
A second correction, same date: the condo figures on this page used to include parcels that are not homes. Parking spaces, storage units and building common areas are recorded, and sold, as condominium parcels, and the Assessor flags them in a separate file. They were 3,522 of the 249,371 sale records in the file, between 3 and 5 percent of condo sales each year, at a median price of $27,500. They are now left out, which leaves 245,849 sales and raises every condo median: the citywide 2025 figure, $328,000 when first published, is $337,750. The 2025 medians for houses ($320,000) and two-to-six-flats ($445,000) are the same as first published.
The Assessor flags sales that are not real market transactions: repeat filings of the same sale within a year, sales under $10,000, and deed types that usually carry no market price, such as the quitclaim deeds relatives use to hand property to one another. We kept only sales of a single property that pass all of those screens, and we left out the condominium parcels the Assessor flags as parking spaces, storage units or building common areas. A median below is the middle sale of what traded that year; a community area’s mix of what sells can shift from year to year, and no figure in this piece rests on fewer than 20 sales unless its exact count is shown beside it. That rule leaves gaps. Five of the 77 community areas recorded fewer than 20 house sales in 2025 and carry no house median for that year; condos clear the bar in 38 community areas and two-to-six-flats in 46.
In this report: Flats vs. houses vs. condos · Where houses rose fastest · Where flats rose most · Million-dollar medians · The map · Method
The two-to-six-flat now costs more than a house or a condo
In 2018 the medians of the three kinds of Chicago home sat within $36,500 of one another. The median condo went for $255,000, the median two-to-six-unit building for $245,000, and the median house for $218,500. Seven years later they have split into three different markets. Houses are up 39 percent since 2019, to $320,000 in 2025. Condos are up 26 percent, to $337,750. The two-to-six-flat is up 62 percent, to $445,000.
That order is new in this record. In 2018 the two-to-six-flat sat between the other two. It is now the most expensive of the three by more than a hundred thousand dollars at the median, and its lead over houses widened in every calendar year of this record, 2018 through 2025. Why? A deed states a price and nothing about why the buyer paid it. Our reading is that a building with rent coming in is being priced on that rent; the sales file cannot confirm it. What the file does show is a higher price, which is good news for anyone selling one of these buildings and hard news for anyone hoping to buy one, live on one floor and rent out the others.
The condo story runs the other way. Condos carried a $36,500 premium over houses in 2018. By 2025 that premium had shrunk to $17,750. In the Loop the median condo sold for $296,750 in 2019 and $325,000 in 2025, a gain of ten percent across six years in which the city’s houses gained 39 percent. Among the 37 community areas with at least 20 condo sales in both years, only Kenwood’s condos gained as little, also ten percent; the Near South Side is next, at twelve percent. A slow Loop is consistent with what our business-license analysis and our count of Red Line subway ridership both show from different angles.
House prices rose fastest where they were lowest
In 2019, twenty community areas had a median house sale under $150,000. In 2025, five did: Englewood, Roseland, South Chicago, South Deering and West Pullman.
The two largest percentage gains in the city are in West Englewood and Englewood. West Englewood’s median house sale went from $40,000 in 2019 to $152,500 in 2025, across 242 recorded sales in that final year. Englewood went from $32,341 to $115,000. Pullman went from $68,900 to $178,000, Roseland from $70,000 to $144,000, South Chicago from $71,600 to $137,450. The largest gain on the North Side was 66 percent, in North Center.
Two cautions belong next to those numbers. The first is about what a median measures. It is set by whichever houses sold that year, so when the middle sale is $32,341, as it was in Englewood in 2019, some of any later rise can come from a different mix of houses reaching the market, and a deed cannot tell that apart from the same houses tripling in value. The second is that higher prices at the bottom cut both ways: they add equity for the people who already own there, and they make the city’s cheapest homeownership less cheap. The backdrop is a county that started growing again in 2023 after years of decline, and a metro that still trades people with its own suburbs more than with any other place.
Where two-to-six-flat prices rose most
The rise in two-to-six-flat prices is not spread evenly. Of the 46 community areas with at least 20 two-to-six-flat sales in both 2019 and 2025, the thirteen with the largest percentage gains are all south or west of downtown; the first North Side community area, Uptown, ranks fourteenth. West Englewood leads: its median two-to-six-flat sold for $63,000 in 2019 and $220,000 in 2025. Woodlawn’s went from $190,000 to $462,000, across 97 recorded sales in 2025. Grand Boulevard went from $285,000 to $675,000. Washington Park went from $215,000 to $562,500. Austin, the West Side’s largest community area, went from $215,000 to $369,950 across 250 sales, more two-to-six-flat sales than any other community area recorded that year.
Woodlawn borders the Obama Presidential Center site, and both its houses and its small apartment buildings have repriced: the median house sale there went from $114,678 to $347,500 over the same years, on modest counts (35 house sales recorded in 2019, 39 in 2025). Whether that reads as renewal or as pressure depends on which side of a lease you are on. Our South Shore renter-protections piece covers the housing ordinance the city passed for Woodlawn in 2020 and South Shore’s push for one of its own. The deeds do not say who rents in these buildings, what the rent is or whether anyone was displaced. They do say what the buildings now cost.
Where the median house now costs a million dollars
At the other end of the price range, the median house sale is above $1 million in six community areas. In North Center in 2025 it was $1,622,500, with Lincoln Park at $1,580,000, Lake View at $1,575,000, the Near North Side at $1,327,500 and Uptown at $1,100,102. West Town, officially a West Side community area though its buyers know it by names like Wicker Park, crossed a million for the first time in this record at $1,085,250, after closing 2024 one thousand dollars short at $999,000. Each of those figures is a median: half of the houses that sold in those areas cost more.
The smallest gains are at the expensive end. The Near West Side gained 16 percent since 2019, Hyde Park 17 percent, the Near South Side 18 percent, the three smallest gains among the 70 community areas with at least 20 house sales in both years. The fifteen community areas with the lowest house medians in 2019 gained a median of 100 percent; the fifteen with the highest gained 35 percent. So the gap narrowed: the most expensive community area’s median house cost 41 times the cheapest’s in 2019 and 14 times in 2025. For national context, see our look at where Chicago sits in the housing-shortage rankings.
Watch seven years of prices move across the map
Drag the slider and the map repaints with each year’s recorded house medians. Twelve community areas darken by two shades between 2018 and 2025, among them West Englewood, Pullman, Auburn Gresham and Woodlawn. Lincoln Park and Lake View do not change shade at all: they were already in the darkest band in 2018. Gray areas have fewer than 20 recorded house sales in that year, which in places like the Loop mostly means the housing there is condos.
How many homes changed hands, and why the 2025 count kept growing
| Year | Recorded market sales |
|---|---|
| 2018 | 32,525 |
| 2019 | 30,586 |
| 2020 | 29,273 |
| 2021 | 37,014 |
| 2022 | 31,712 |
| 2023 | 25,359 |
| 2024 | 24,711 |
| 2025 | 24,885 |
Chicago recorded 30,586 market sales of houses, condos and two-to-six-flats in 2019 and 37,014 in 2021, the most of any year here. The count fell to 25,359 in 2023 and 24,711 in 2024. For 2025 the file holds 24,885 so far. The file records how many sales there were; it does not record why there were fewer.
That 2025 figure is a minimum. When we first read the file, on July 18, 2026, it held 19,720 sales for 2025, a count that still included the parking and storage parcels. By its September 15, 2026 update it held 25,222 on the same basis, because the county had added 5,502 sales dated 2025, 28 percent more, while its counts for 2018 through 2024 did not change by a single sale. More than a fifth of the 2025 sales now on file arrived after July 18, 2026. Some arrived more than a year late: in a narrower count that we had saved row by row, 1,147 of the added sales were dated January through April 2025 (the corrected count).
Our reading: no count for the most recent year or two in this file is final, and a drop in the latest year may only mean the file has not caught up. So this page draws no conclusion from where the 2025 count stands against any other year, and it compares nothing in 2026, whose newest recorded sale is dated July 14, 2026 and whose earlier months are still arriving. The prices were far steadier than the counts between our two readings. The added sales moved no citywide 2025 median by more than $1,000. In the community areas, where a year can rest on a few dozen sales, 19 of the 147 medians that had at least 20 sales behind them in July moved by more than 5 percent. One year’s median for a community area with few sales is the least stable kind of number on this page.
How we computed this
- Sales: Cook County Assessor Parcel Sales file (dataset wvhk-k5uv), all recorded sales in the eight Cook County townships that the county assesses as the City of Chicago (township codes 70 through 77), January 2018 through July 14, 2026, retrieved September 30, 2026 (file last updated September 15, 2026). Any city land assessed in a suburban township is not included. First read July 18, 2026; the two readings are compared above.
- Market filter: we kept only sales of a single parcel that pass the Assessor’s own screens for arms-length sales (sales between unrelated parties at a market price), which exclude repeat filings of the same sale within a year, sales under $10,000, and non-market deed types such as quitclaims.
- Parking and storage: a condominium parcel can be a parking space, a storage unit or a building common area. The Assessor flags those in its condominium file (dataset 3r7i-mrz4). We dropped every sale of a parcel flagged that way in any tax year since 2018: 3,522 sales. The Assessor describes identifying these parcels as an ongoing cleanup, so the flag is not perfect: 257 of the sales we dropped were for more than $100,000 and may have been homes, and 480 condo sales under $40,000 carried no flag and remain in.
- Home types: “houses” are Assessor classes 202–210, 234, 278, and 295 (detached homes and townhomes), “condos” are class 299, and “two-to-six-flats” are class 211 apartment buildings.
- Community areas: each parcel’s coordinates from the Assessor’s Parcel Universe (nj4t-kc8j) were placed into the city’s 77 official community areas (boundaries dataset igwz-8jzy). All 245,849 sales joined; none fell outside.
- Reading the numbers: a median is the middle recorded sale, not an appraisal of any particular home; recorded prices can also differ from a buyer’s true net cost, since seller credits and concessions are not part of the deed. The mix of what sells shifts between years. We suppress figures built on fewer than 20 sales (10 in the lookup, where the count is shown). Counts for 2025 and 2026 are sales recorded so far; the file keeps adding sales for more than a year after they happen.
Computed by KCM Desk from the county’s sales file as retrieved September 30, 2026; first published July 18, 2026, corrected and recomputed September 30, 2026. We plan to read the file again in early 2027; its 2026 count will still be incomplete then. Human-guided and edited — about this desk. If you spot an error, corrections come first.
Related Keep Chicagoland Moving coverage
- Chicago Housing, by the Numbers
- Chicago Houses That Closed in June Sold for 12 Percent More Than January’s in the Same Area, 2018 to 2024. Condominium Closings Ran Twice as High in May
- Chicago’s January–April House Sales Now Read 5.6 Percent Below Last Year, Not 23 Percent Above — the County Added 1,147 Sales to 2025 After Our July Count
- Illinois Has Gained Population Three Years Straight. Here’s Why You Never Heard.
- The IRS Counted 162,000 People Leaving Cook County. The Top Destination Was DuPage.
- America Is Short 4.7 Million Homes. Chicago Isn’t on the Worst-Off Lists — Here’s What That Means.
- One Map, Three Chicagos: Where the City Builds, Opens, and Rides