One Map, Three Chicagos: Where the City Builds, Opens, and Rides
Our three computed datasets - construction permits, new business licenses, and L station recovery - painted onto one interactive map of the 77 community areas. Tap between the views and watch the same city rearrange itself.
We’ve now measured Chicago three ways with public records from the city’s data portal: where it pulls building permits, where it opens licensed businesses, and where people still enter the L (CTA data published through the same portal). Each dataset got its own article. This page puts them on one map. Tap between the three views, and the city’s 77 official community areas rearrange themselves into different cities.
Building: new-construction permits, first half of 2026
KCM Desk computations from City of Chicago datasets (permits, business licenses, CTA station entries), each detailed with method and exclusions in the linked analyses. Hover or tap any neighborhood for its numbers. Train view covers the 30 community areas containing comparable L stations.
What the three map views show
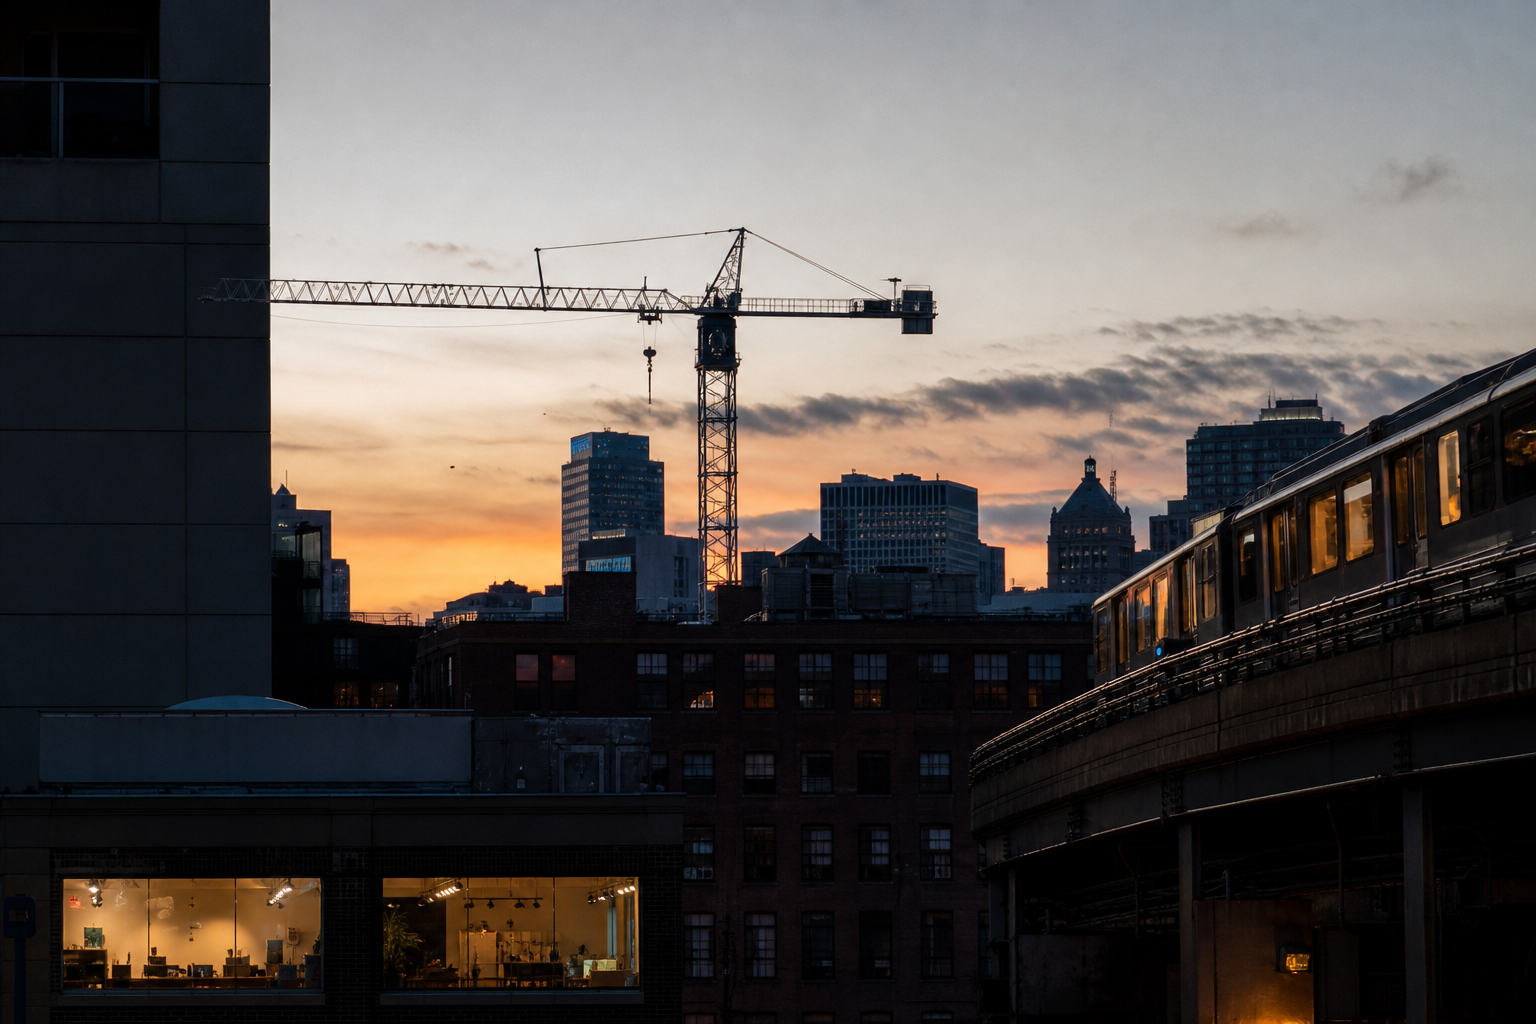
The Near West Side looks like two different neighborhoods, depending on the button. On the building view, it leads the entire city with 53 new-construction permits in the first half of 2026, up from 31 in the same months of 2025. Flip to business, and it turns red: -22% in new licensed locations versus 2019. The cranes are ahead of the cash registers there, whatever that ultimately means.
The Loop produces an inversion that may surprise readers. Its business view is the darkest red among the big commercial centers (-38%), and its train view shows entries at 60% of 2019. Yet on the building view, it is still one of the busiest squares on the map, with 44 permits in half a year. Construction activity persists downtown even as the other two measures, new business licensing and station entries, sit far below their pre-pandemic marks.
Armour Square, the community area that contains Chinatown, leads the train view at 92% of pre-pandemic entries. It is the closest thing the map has to full recovery, while staying quiet on the other two views. Different neighborhoods are carrying different parts of the city’s comeback, and no single view catches it.
How to read this map honestly
Each view keeps the definitions and exclusions of its parent analysis: permits count filings, not finished buildings; licenses count locations that told City Hall they exist, with one vendor-stall artifact excluded; the train view averages stations within each area and leaves out construction-distorted stations entirely, so areas without comparable stations stay pale. The three measures also cover different windows (six months, six years, and a 2019 comparison, respectively). The map presents three honest snapshots side by side, not one unified score. We deliberately did not blend them into an index because a composite number would manufacture precision the underlying data doesn’t have.
Computed by KCM Desk as of July 17, 2026; each view refreshes on its parent analysis’s schedule. Spot an error? Corrections come first. Human-guided and edited — about this desk.