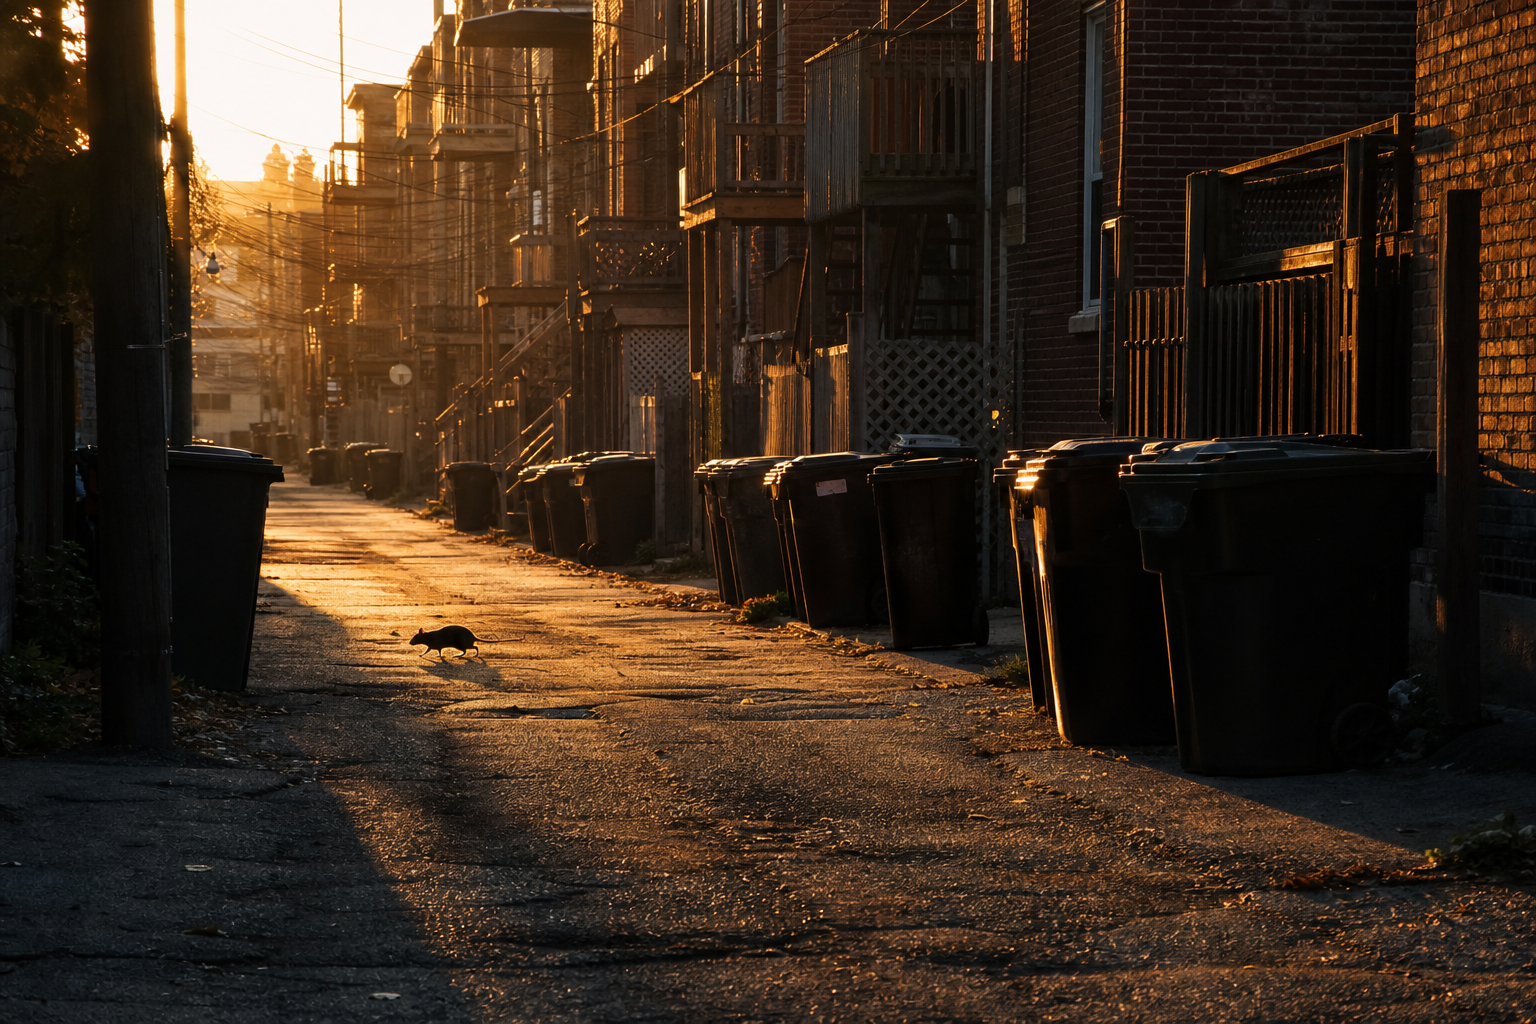
It Is Peak Rat Season in Chicago. The City’s Own Rat Ledger Tells a Better Story Than the Trophy.
Chicago has been named America's rattiest city ten years running - by a pest-control company counting its own treatments. The city's actual 311 rat ledger, all 372,251 complaints of it, tells a richer story: a 2021 peak, four straight years of decline, a July rat season peaking now, and a rat map crowned by Lake View. With an interactive report card for all 77 neighborhoods.
Chicago has now been named America’s rattiest city for ten consecutive years. Here is the part of that story that rarely makes the headlines: the ranking comes from Orkin, and by the company’s own description it counts the number of new rodent treatments Orkin performed in each metro. It measures pest-control business, in raw volume, in the third-largest metro area in the country. That is not nothing, but it is not a rat census either. Chicago happens to keep something much closer to one: the city’s 311 system logs every request filed under “Rodent Baiting/Rat Complaint,” publicly, since early 2019. We computed all of it.
372,251
rodent complaints since Feb 2019
July
peak rat season. It is July.
4 years
of falling complaints since the 2021 peak — until this year
Rat season is real, and this is its peak week
All figures: KCM Desk computation from the city’s 311 service-request data, pulled July 18, 2026. Hover any point for exact counts.
Rat complaints follow the calendar with remarkable consistency. Across the last six full years, Chicagoans filed 38,383 rodent complaints in July, the busiest month, and 12,972 in February, the quietest. That is roughly a 3-to-one swing: complaints climb through spring, crest in July, and slide back down through fall, year after year. The data records the pattern, not its causes. What it means right now is simple enough: this article is being published in the month the curve tops out.
The surprise in the trend: complaints fell for four straight years
The pandemic years were the busy years for the complaint line. Requests jumped from 54,068 in 2020 to 65,897 in 2021, the highest total in the dataset. Those were the years when pandemic-era rat sightings were a national story, and whatever mix of rodent behavior and human attention drove it, the phone data records the surge plainly. What happened next got far less attention: complaints then fell every single year, down 33% by 2025. The rattiest-city trophies kept arriving during exactly the years the city’s own complaint line was quieting down.
Then there is this year. Through June, 2026 is running at 19,790 complaints against 18,979 in the same months of 2025, an increase of about 4%. That is a comparison of half-years, not a final annual figure, but it is the first time since the peak that the pace has run ahead of the prior year, and the busier half of the calendar is just beginning. Whether the four-year streak survives 2026 is now a live question, and this page will get the answer in January.
Where the complaints come from: a North Side story
The rat map defies the assumptions people usually bring to city-problem maps. In 2025, the most complained-about square miles in Chicago were some of its most desirable: Lake View led the city at 608.9 complaints per square mile, and West Town, which contains Wicker Park and Bucktown, filed more total complaints than any other community area (2,373). Bridgeport, Avondale, Rogers Park, and Albany Park fill out the top tier. The far South Side’s industrial areas barely register.
Two forces are stacked in that pattern, and honesty requires naming both. Dense neighborhoods full of century-old buildings, shared alleys, and garbage carts genuinely produce more rat habitat per block. And it is reasonable to expect, though the data cannot prove it, that neighborhoods where residents know 311 and trust it to respond will file more reports for the same number of rats. A complaint reflects a sighting and the decision to report it. The map shows both at once, and no dataset the city publishes can separate them.
Look up your own neighborhood
How fast the city actually responds
Completed requests in the log carry two timestamps, one for filing and one for closure, which makes 311 a scoreboard for the city as much as for the rats. In 2019, completed rodent requests closed in about 3 days on average. By 2022, with pandemic backlogs, that had blown out to almost 9 days. In 2025 it stood at 4.1 days citywide, and the neighborhood lookup above shows your own area’s figure. A closed request means the city marked the work complete; it does not certify that the rats packed up and left.
What a complaint can and cannot count
Nobody counts rats. Orkin counts its customers, and the city counts its callers, and each is an honest measure of something adjacent to rodents rather than the rodents themselves. This analysis counts every request typed “Rodent Baiting/Rat Complaint” in the city’s 311 system, which began in its current form in early 2019, so 2019 is a partial year and sits outside our trend claims. One address complaining five times counts five times. None of this measures the suburbs. Within those limits, it is an unusually complete public record, and it is updated continuously: when we pulled the data on the morning of July 18, the newest complaint in it was a few hours old.
Sources & data
City of Chicago Data Portal, 311 Service Requests (type: Rodent Baiting/Rat Complaint; February 2019 through July 18, 2026, pulled July 18, 2026). Method: counts by year, month, and community area; density uses official community-area boundary areas; response time averages completed requests’ created-to-closed interval.
Orkin — rattiest-cities ranking and its stated methodology; ABC7 Chicago — the tenth consecutive title
Computed by KCM Desk as of July 18, 2026. The dataset updates daily; we’ll revisit with full-year 2026 numbers in January, when the four-year question gets its answer. Spot an error? Corrections come first. Human-guided and edited — about this desk.