
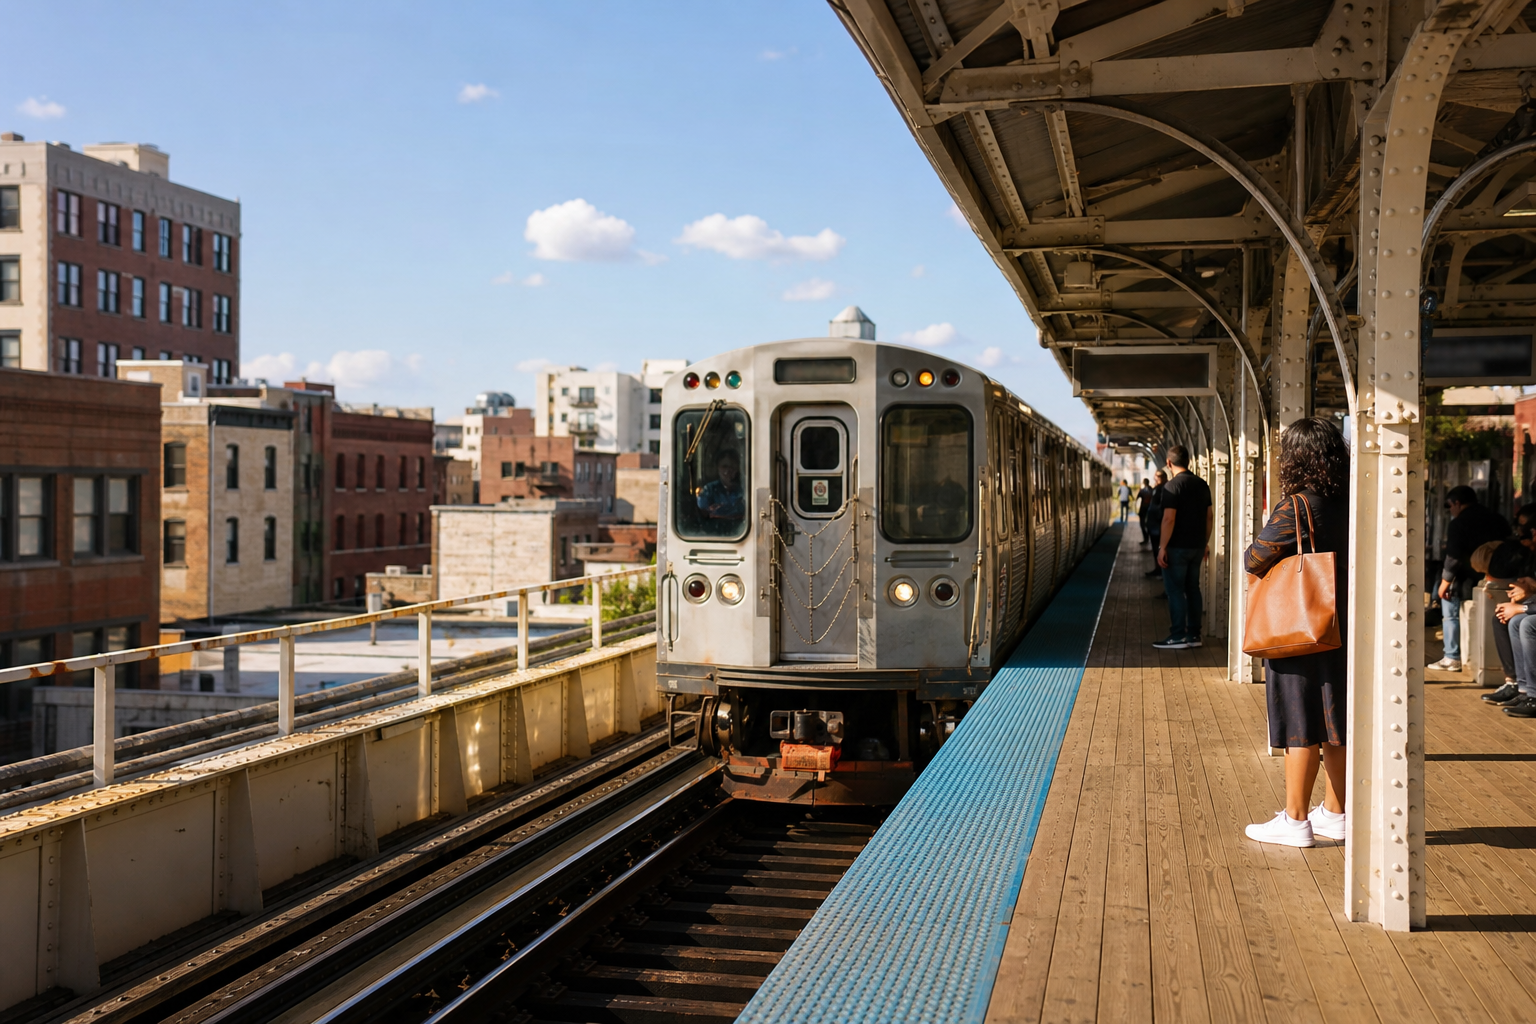

Among the 132 L stations where a clean comparison is possible, exactly two carried more weekday riders in January–May 2026 than in the same months before the pandemic: Cermak-Chinatown, at 110 percent of its 2019 average, and Morgan in Fulton Market, at 106 percent — and neither is a Loop station. That is the finding of our station-recovery analysis, which compared average weekday entries for January–May 2026 against the same months of 2019 at the 132 stations where the comparison is clean — open in both years, no construction distortion. Here are the ten stations with the highest recovery — the largest share of their 2019 weekday average retained — plus the six lowest.
The ten highest recoveries
1. Cermak-Chinatown — 110 percent of 2019
Cermak-Chinatown averaged 4,024 weekday entries in January–May 2026 against 3,660 in the same months of 2019 — 110 percent, the No. 1 recovery level among the 132 stations with clean comparisons. It is one of only two stations above their 2019 level among the 132 cleanly comparable stations.
2. Morgan (Lake) — 106 percent of 2019
Morgan (Lake) averaged 3,634 weekday entries in January–May 2026 against 3,424 in the same months of 2019 — 106 percent, the No. 2 recovery level among the 132 stations with clean comparisons. Morgan is the second of those two stations.
3. Grand/Milwaukee — 91 percent of 2019
Grand/Milwaukee averaged 2,540 weekday entries in January–May 2026 against 2,779 in the same months of 2019 — 91 percent, the No. 3 recovery level among the 132 stations with clean comparisons.
4. Cermak-McCormick Place — 84 percent of 2019
Cermak-McCormick Place averaged 1,420 weekday entries in January–May 2026 against 1,699 in the same months of 2019 — 84 percent, the No. 4 recovery level among the 132 stations with clean comparisons.
5. Garfield (Green Line) — 83 percent of 2019
Garfield (Green Line) averaged 788 weekday entries in January–May 2026 against 952 in the same months of 2019 — 83 percent, the No. 5 recovery level among the 132 stations with clean comparisons.
6. O’Hare — 79 percent of 2019
O’Hare averaged 8,401 weekday entries in January–May 2026 against 10,587 in the same months of 2019 — 79 percent, the No. 6 recovery level among the 132 stations with clean comparisons.
7. Western (Pink Line) — 78 percent of 2019
Western (Pink Line) averaged 818 weekday entries in January–May 2026 against 1,045 in the same months of 2019 — 78 percent, the No. 7 recovery level among the 132 stations with clean comparisons.
8. Damen (Pink Line) — 78 percent of 2019
Damen (Pink Line) averaged 1,146 weekday entries in January–May 2026 against 1,471 in the same months of 2019 — 78 percent, the No. 8 recovery level among the 132 stations with clean comparisons.
9. Ashland (Orange Line) — 78 percent of 2019
Ashland (Orange Line) averaged 1,156 weekday entries in January–May 2026 against 1,488 in the same months of 2019 — 78 percent, the No. 9 recovery level among the 132 stations with clean comparisons.
10. Cottage Grove — 77 percent of 2019
Cottage Grove averaged 715 weekday entries in January–May 2026 against 933 in the same months of 2019 — 77 percent, the No. 10 recovery level among the 132 stations with clean comparisons.
The six lowest recoveries
Monroe (Red Line) — 41 percent of 2019
Monroe (Red Line) averaged 4,066 weekday entries in January–May 2026 against 9,840 in the same months of 2019 — 41 percent, among the six weakest clean comparisons in the system.
Western (Brown Line) — 43 percent of 2019
Western (Brown Line) averaged 1,651 weekday entries in January–May 2026 against 3,832 in the same months of 2019 — 43 percent, among the six weakest clean comparisons in the system.
Kedzie-Homan (Blue Line) — 46 percent of 2019
Kedzie-Homan (Blue Line) averaged 781 weekday entries in January–May 2026 against 1,707 in the same months of 2019 — 46 percent, among the six weakest clean comparisons in the system.
Monroe (Blue Line) — 47 percent of 2019
Monroe (Blue Line) averaged 3,733 weekday entries in January–May 2026 against 8,025 in the same months of 2019 — 47 percent, among the six weakest clean comparisons in the system.
Lake (Red Line) — 48 percent of 2019
Lake (Red Line) averaged 9,715 weekday entries in January–May 2026 against 20,292 in the same months of 2019 — 48 percent, among the six weakest clean comparisons in the system. Its share rounds to the same 48 percent as Dempster-Skokie’s, so both are listed rather than cut at five.
Dempster-Skokie — 48 percent of 2019
Dempster-Skokie averaged 832 weekday entries in January–May 2026 against 1,736 in the same months of 2019 — 48 percent, among the six weakest clean comparisons in the system. Its share rounds to the same 48 percent as Lake (Red Line)’s, so both are listed rather than cut at five.
Three of the six are subway stops beneath the Loop. What that geography means is the subject of the full analysis; this page stops at the counts.
Questions these numbers can answer
Which L stations are busier than before the pandemic? Two of the 132 stations with clean comparisons: Cermak-Chinatown (110 percent of its January–May 2019 weekday average) and Morgan, in Fulton Market (106 percent). Every other cleanly comparable station sat below its 2019 level in the same 2026 window.
Why are some stations missing from this list? The parent analysis set aside eleven stations whose numbers reflect construction rather than demand — State/Lake, the Forest Park branch stations, Racine, UIC-Halsted, and Washington/Wabash among them — and documents the basis for each exclusion. Their absence here is the screen working; the list and its sourcing are in the full analysis.
How far back is the L overall? On the parent analysis’s matched window — average weekday entries, January–May 2026 versus January–May 2019 — the system ran at 61.6 percent. Our bus-vs-L analysis, linked below, reports the L at 65 percent on its own measure — total rides rather than weekday-only station entries — and each page states its window and metric.
Where these numbers come from
CTA L station daily entry totals (5neh-572f), current through May 31, 2026 at the parent analysis’s retrieval: average weekday entries for January–May 2026 and the same five months of 2019, per station, with construction-affected stations excluded per the screen described above. Station names follow the CTA file’s labels, shortened for display where the file’s form is internal (the file’s “Morgan-Lake” appears here as Morgan (Lake)). The full method, every station’s figure, and the exclusion list: Only Two L Stations Are Busier Than Before the Pandemic. Neither Is Downtown.
Computed by KCM Desk from records current to May 31, 2026. Human-guided and edited — about this desk. If you spot an error, corrections come first.