
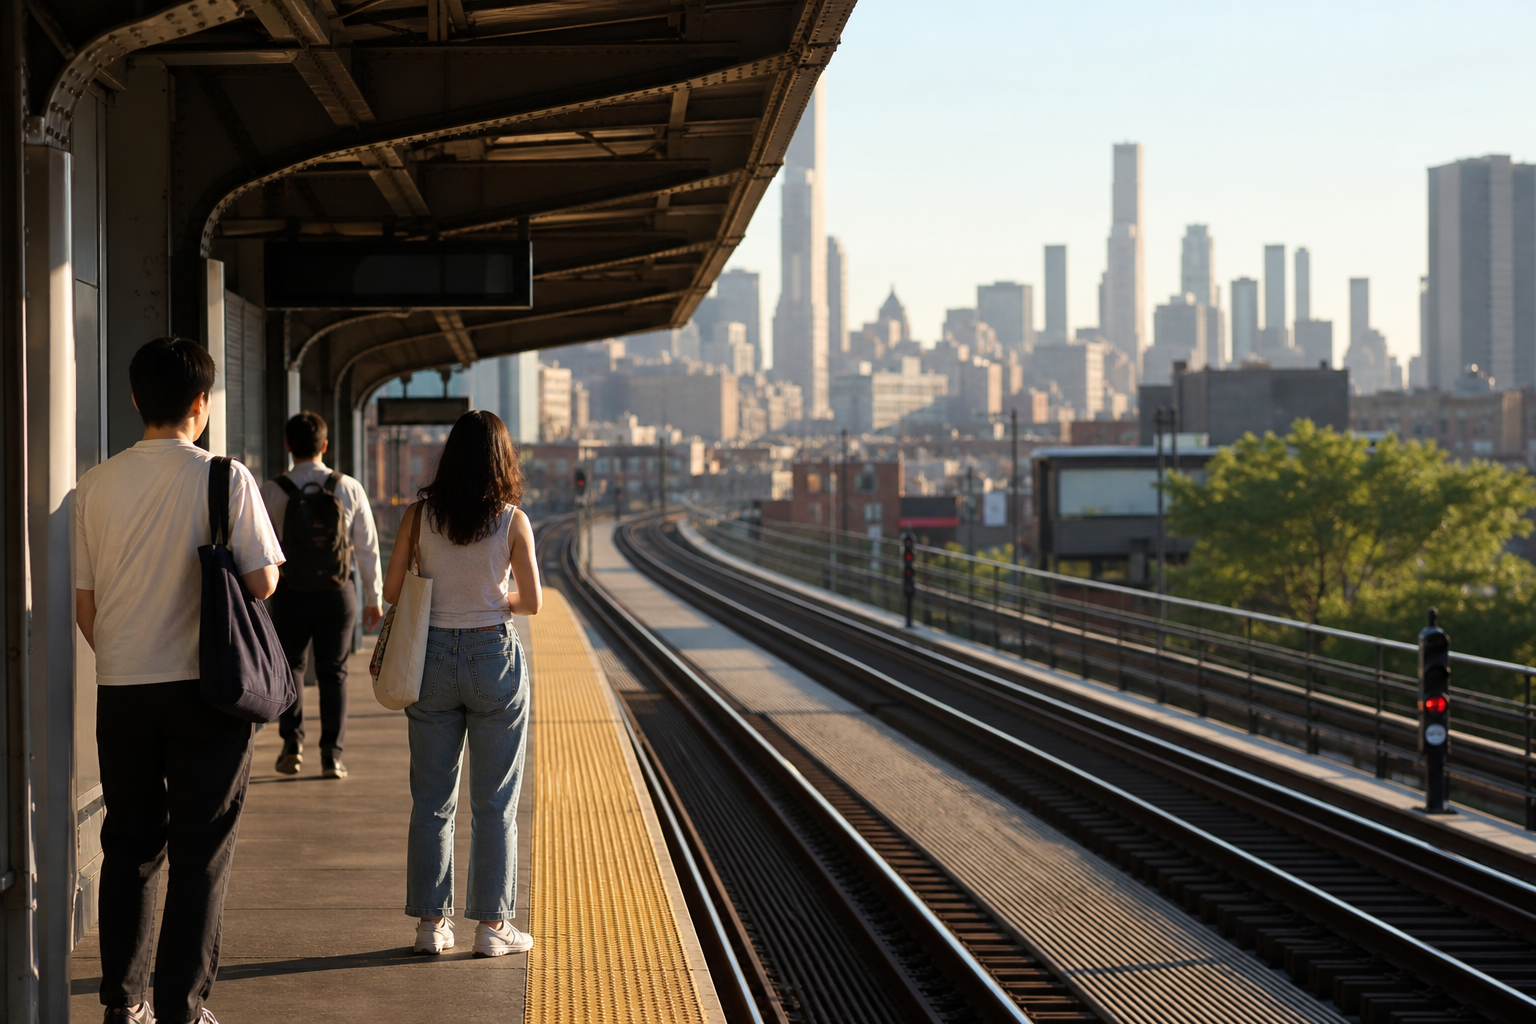

The L is carrying about 62% of its pre-pandemic weekday riders, but that single number hides the actual story. We pulled entry counts for all 144 stations from the city’s data portal and compared this year with 2019, station by station. Among the 132 stations where the comparison is clean because they were open both years and had no construction distortion, exactly two are busier than they were before the pandemic. Neither is downtown: Cermak-Chinatown (110% of 2019) and Morgan, in Fulton Market (106%). Meanwhile, the subway stations under the Loop’s office core are running at 41–51%. Chicago’s transit recovery looks different across the map. Stations serving destination neighborhoods have refilled far faster than stations that feed office towers.
How we calculated station ridership recovery
The CTA publishes daily entry totals for every L station, current through May 31, 2026. We averaged weekday entries for January–May 2026 and the same five months of 2019 for every station that existed in both years. This compares identical seasons and weekdays only. Systemwide across those stations, there were 567,475 average weekday entries then and 349,505 now, or 61.6%.
One honesty rule applies before the rankings: construction moves riders around, and pretending otherwise would make this analysis misleading. We excluded twelve stations whose 2026 numbers reflect closures rather than demand. They include State/Lake, closed since January 5 for a three-year rebuild; the Forest Park branch stations affected by the $268 million Forest Park Branch Rebuild; and Washington/Wabash, whose near-perfect 98% is partly explained by State/Lake’s displaced riders walking one block. The full exclusion list is at the bottom.
The two stations with more riders than in 2019
Cermak-Chinatown averaged 3,660 weekday entries in early 2019 and 4,024 this year. Morgan, the Green/Pink Line stop in Fulton Market, went from 3,424 to 3,634. Neither station serves an office-tower district. They serve dense destination neighborhoods where people live, eat, and increasingly work. In Fulton Market’s case, our permit analysis found the neighborhood at the center of the city’s construction surge, with the Near West Side leading all 77 community areas.
This chart shows KCM Desk analysis of CTA station-entry data (City of Chicago Data Portal), using weekday averages for Jan–May 2026 vs. Jan–May 2019. Hover over any bar for exact figures.
Look up your own stop: We turned this dataset into an interactive station lookup that shows every station’s quarter-century on demand.
Downtown office stations have the weakest recovery
After construction effects are removed, the least-recovered stations cluster with uncomfortable precision: Monroe/State at 41%, Monroe/Dearborn at 46%, Lake/State at 48%, and Jackson/State at 51%. These are the Red and Blue Line subway stops that deliver office workers to desks. They once absorbed 8,000–20,000 entries every weekday and now run at roughly half that level. The airports fall between those extremes, with O’Hare at 79% and Midway at 61%. Big neighborhood stations, including Belmont, Logan Square, and 95th/Dan Ryan, sit in the low 60s, near the system average.
We can say plainly what this data can and can’t support: it counts people entering stations, not why they enter them. The downtown pattern is consistent with hybrid work hollowing out the five-day commute, but station entries cannot prove motive. Only three stations outside the construction zones are even at 90% of 2019. The recovery has a long tail everywhere, and it is longest where the cubicles are.
What station entries can tell renters about city neighborhoods
Station entries are an imperfect but honest signal of how much activity a corner of the city generates. They cannot measure storefronts or nightlife directly. By this measure, Chinatown and Fulton Market are the only places on the L map generating more activity than in 2019. If your life depends on a five-day Loop commute, emptier downtown stations mostly mean shorter platform waits. They also help explain why downtown-adjacent policy fights and office-to-residential conversions will keep dominating city politics. Station entries near half of 2019 mean far less daily foot traffic feeding Loop street life than the pre-pandemic normal.
The map also records one newer development: Damen-Lake, the Green Line station that opened in August 2024, already averages about 960 weekday entries. It has no 2019 baseline for comparison. The station is one stop west of Morgan, in the same corridor as one of the two recovery leaders.
Sources and data methodology
- City of Chicago Data Portal provides CTA Ridership: L Station Entries, Daily Totals (dataset 5neh-572f, through May 31, 2026; pulled July 17, 2026). The method uses the average of daytype-W (weekday) entries per station, Jan 1–May 31, each year; stations with 2019 weekday averages under 100 are excluded from ratios.
- Block Club Chicago reports on the State/Lake closure (January 2026–2029).
- CTA via Mass Transit covers the Forest Park Branch Rebuild, $268M, and phased station closures.
- The stations excluded as construction-affected are State/Lake; Forest Park, Harlem, Oak Park, Pulaski, Cicero, Austin, Western and Kedzie-Homan (Forest Park branch); Racine; UIC-Halsted; and Washington/Wabash (inflated by State/Lake’s closure).
KCM Desk computed and verified this analysis against the sources above as of July 17, 2026. The dataset updates monthly, and we’ll revisit it when full-year data lands. Want the numbers for a station we didn’t chart? Ask — we have all 144.
Related Keep Chicagoland Moving coverage
- Chicago Transit, by the Numbers
- The L Stations With the Highest Ridership Recovery, Ranked
- Chicago’s Buses Are Back to 86% of Pre-Pandemic Ridership. The ‘L’ Is at 65%.
- One Map, Three Chicagos: Where the City Builds, Opens, and Rides
- The L’s Best Year Was 2015, Not 2019. A Quarter Century of Ridership in Three Charts.
- One Chicago Speed Camera Recorded 166,666 Violations in Its First Year. Here Is the Leaderboard.
- Chicago Issued 698 New-Construction Permits in the First Half of 2026. Here’s Where They Went.
- Red Line Extension 2026: 5.5 Miles That Could Change Chicago’s South Side
- Chicagoland’s Reduced-Fare Transit Program: Who Qualifies