

This page includes links to products on Amazon. As an Amazon Associate I earn from qualifying purchases.
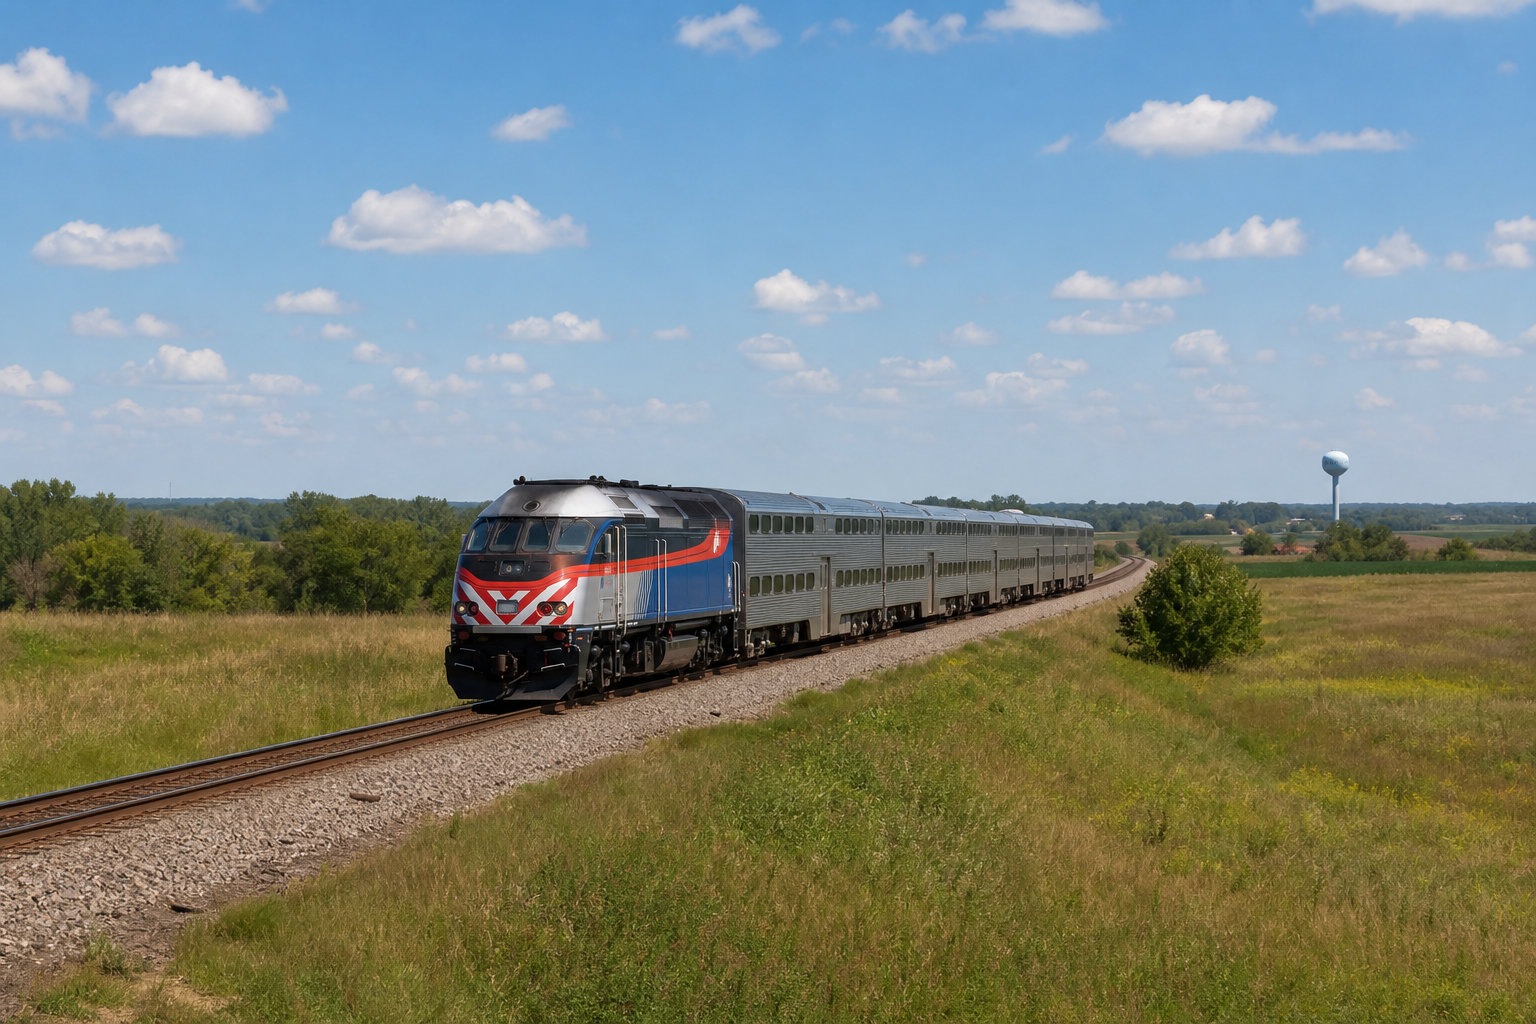
One railroad organizes the northwest suburbs the way a spine organizes a body. The Union Pacific Northwest Line leaves Ogilvie Transportation Center and remains useful all the way to Harvard, near the Wisconsin border. Its corridor spans nearly the entire Chicagoland housing market, from a $175,000 median in Harvard to over $900,000 in the Barrington countryside. This list presents the numbers as a companion to our west suburbs reference, using the same method.
How the northwest suburbs are defined
We used the same rule as the west list: we followed the railroad. The UP-NW’s suburban stops run through Cook County into McHenry County. We list every suburb with a station, plus notable communities in the same corridor that have no station of their own. Stops inside the City of Chicago, including Jefferson Park, Norwood Park, Edison Park and others, belong to the city and are not included here.
Two boundary notes help keep towns in the right list. Schaumburg and Hanover Park ride the Milwaukee District West line and appear on the west list. Wheeling, Prospect Heights, and Buffalo Grove ride the North Central Service, which is a different corridor.
Every figure comes from the U.S. Census Bureau’s American Community Survey (2020–2024 five-year estimates, the most recent release), and every station assignment was checked against Metra’s published UP-NW station list in July 2026. Where a town has more than one station, including Park Ridge, Des Plaines, Arlington Heights, and Crystal Lake, it appears once.
Northwest suburbs by train service and housing data
Towns served by the Union Pacific Northwest Line
Ogilvie Transportation Center to Harvard, with a branch to McHenry. The table includes 12 towns.
| Town | Population | Median home value | Median household income |
|---|---|---|---|
| Arlington Heights | 76,005 | $414,500 | $116,723 |
| Palatine | 66,293 | $355,600 | $97,819 |
| Des Plaines | 59,156 | $335,600 | $97,875 |
| Mount Prospect | 55,472 | $397,400 | $101,720 |
| Crystal Lake | 40,579 | $311,400 | $108,418 |
| Park Ridge | 38,667 | $551,200 | $142,986 |
| McHenry | 28,074 | $266,500 | $86,315 |
| Woodstock | 26,147 | $245,700 | $82,758 |
| Cary | 17,923 | $309,800 | $113,026 |
| Barrington | 11,077 | $582,500 | $147,989 |
| Harvard | 9,598 | $175,400 | $67,617 |
| Fox River Grove | 4,523 | $298,900 | $121,506 |
Communities in the corridor without their own Metra station
These communities are in the corridor but do not have a station of their own. The table includes 11 towns.
| Town | Population | Median home value | Median household income |
|---|---|---|---|
| Hoffman Estates | 51,175 | $351,900 | $106,806 |
| Streamwood | 39,001 | $271,200 | $101,218 |
| Elk Grove Village | 31,987 | $347,100 | $94,175 |
| Algonquin | 30,067 | $351,000 | $134,525 |
| Lake in the Hills | 28,800 | $321,900 | $117,151 |
| Huntley | 28,005 | $334,300 | $88,536 |
| Rolling Meadows | 24,027 | $326,200 | $98,514 |
| Lake Zurich | 19,832 | $435,300 | $135,968 |
| Inverness | 7,275 | $715,600 | $207,434 |
| South Barrington | 5,021 | $908,300 | $221,575 |
| Barrington Hills | 3,879 | $913,600 | $205,074 |
What the home values show along the corridor
Home values span a five-fold range along one line. Harvard, at the far end of the line, posts a $175,400 median home value. It is the cheapest rail-served town we’ve measured on any corridor so far. Barrington Hills and South Barrington, in the same corridor, top $900,000. The train is the same, but the housing markets could hardly be more different.
Home values generally decline toward the end of the line. Close-in Cook towns, including Park Ridge $551,200 and Arlington Heights $414,500, post median values roughly double those at the McHenry County end of the line, including Woodstock $245,700 and McHenry $266,500. Commuters willing to spend longer on the train can get much more for the same money farther from the Loop. Check the express-versus-local schedule before deciding what “longer” actually means.
Communities without stations are not necessarily less expensive. On the west corridors, station towns often price above their stationless neighbors. In the northwest corridor, the pattern is frequently reversed. Inverness ($715,600), South Barrington ($908,300), and Barrington Hills ($913,600) have no stop of their own and sit at the top of the market, while rail-served Harvard and Woodstock anchor the bottom. In the Barrington countryside, distance to a platform is plainly not the only factor shaping prices. That is a caution against reading any single amenity as the market.
How to use these estimates when comparing towns
Census five-year figures are estimates pooled over 2020–2024 and published for a whole municipality. They describe a town, not a house. They carry margins of error and lag today’s asking prices. Median home value is what owners report their homes are worth, not current listings. Use the tables to cut twenty-three towns down to five, then use listings, a train ride, and a walk to pick one.
Budget beyond the sticker price. Illinois home-insurance premiums rose 32% between 2018 and 2022 (Federal Reserve Bank of Chicago; our breakdown), and property taxes differ meaningfully between Cook, Lake, and McHenry counties. Two identical prices can carry very different monthly costs.
Sources and data used for this list
- U.S. Census Bureau, American Community Survey: 2024 five-year estimates, the current release (B01003 population, B25077 median home value, B19013 median household income), retrieved via the Census API on July 16, 2026
- Metra Union Pacific Northwest station list: verified July 17, 2026
Compiled by KCM Desk; figures verified against the sources above as of July 17, 2026. Census estimates carry margins of error and are updated annually; we refresh these tables when new vintages release. Spot an error, or a town we should add? Corrections come first. Human-guided and edited — about this desk.
ON AMAZON
For the move
- Amazon Basics Moving Boxes Kit, Small and Medium, Brown, 15-Pack. Fifteen small and medium moving boxes.
- Duck HD Clear Packing Tape Dispenser Heavy Duty Packaging Tape Gun. A tape gun that comes with one refill roll.
- WEN 72-Inch by 80-Inch Heavy Duty Padded Moving Blankets, 4-Pack. Four padded moving blankets, 72 by 80 inches.
- Felt Furniture Sliders for Hardwood Floors X-PROTECTOR 16 PCS. Sixteen felt sliders for moving furniture on hardwood floors.
Maps of Chicagoland
- Rand McNally Street Guide: Chicago 7-County. A street guide covering Cook, DuPage, Kane, Kendall, Lake, McHenry and Will counties.
- Rand McNally Folded Map: Chicago Regional Map. A folded regional map.
As an Amazon Associate I earn from qualifying purchases.
Related Keep Chicagoland Moving coverage
- Chicago Transit, by the Numbers
- The North Suburbs of Chicago and the North Shore: A Map and List of 55 Towns On and Near Metra’s UP North, Milwaukee District North and North Central Service, With Train Times, Home Values and Rents
- The Southwest Suburbs of Chicago: A Map and List of 31 Towns On and Near the SouthWest Service and Heritage Corridor, With Train Times, Home Values and Rents
- The South Suburbs of Chicago: A Map and List of 46 Towns On and Near the Metra Electric and Rock Island Lines, With Train Times, Home Values and Rents
- Suburban Cook County Recorded 22,092 Births in 2023, 20.7 Percent Fewer Than in 2015 — and Its Fertility Rate Fell in All Four Districts
- The West Suburbs of Chicago: 50 Towns by Train Line, With the Numbers
- Our Barrington coverage: village and subdivision guides
- Frequently Asked Questions About Moving to Chicago