

This page includes links to products on Amazon. As an Amazon Associate I earn from qualifying purchases.
From 2019 through 2024, a Chicago household on Peoples Gas paid an average of about $908 a year for everything on its gas bill except the gas itself, in 2024 dollars and leaving out the city’s 8 percent gas tax. A suburban household on Nicor Gas paid about $473; in 2024 alone the figures were $816 and $450. Chicago has paid about twice what Nicor’s customers paid for twenty years, and lately the Chicago household has used less gas. A newer gap, about $223 a year in 2024, shows up only against Peoples Gas’s own sister utility on the North Shore.
Utility filings to the Energy Information Administration, 2004–2024 · federal pipeline-safety reports, 2004–2025 · Peoples Gas’s own surcharge history · ICC orders of 2023 and 2025 · the comparisons and the theory are oursWhy is my gas bill so high in Chicago?
Because most of it isn’t the gas. By our estimate, about 72 cents of every dollar a Peoples Gas household paid in 2024, leaving out the city’s 8 percent gas tax, went to something other than the gas. Every gas utility reports its residential customers, the gas they used and the revenue it collected to the federal Energy Information Administration each year. Take out what the gas itself cost at the state’s citygate price, the wholesale price where gas enters local pipes, and what is left is our estimate of everything else: delivery, service, taxes and surcharges, plus any difference between what the utility actually paid for its gas and the state average. Averaged over 2019 to 2024, in 2024 dollars, that came to $908 a year for a Peoples Gas customer, $652 for North Shore Gas in the northern suburbs, $636 for Ameren Illinois downstate and $473 for Nicor Gas in most of the suburbs. Whole bills tell the same story. In 2024 the average Peoples Gas household paid $1,217 including the city’s tax (about $1,127 without it) and the average Nicor household $795, though the Chicago household burned 81 thousand cubic feet of gas and the suburban one 90.
Is the gap new? No. Chicago’s premium over Nicor was about $443 a year in 2004–2008, and it hasn’t fallen below $310 in any year since. Whatever makes Peoples Gas expensive to deliver through was there twenty years ago.
Is it because Chicago is so crowded?
Not by itself. Judged by the pipe alone, you would expect the opposite. A gas system is mostly pipe, and in a crowded city each block of pipe serves more households. The federal pipeline-safety reports bear that out: Peoples Gas runs 9.1 miles of main for every 1,000 service lines, against 16.4 for Nicor and 21.7 for Ameren. Less pipe per household should mean a smaller bill for the pipe.
Across seven states, crowding does seem to go with cost. We lined up 26 gas utilities in seven states with old big cities, Illinois, Pennsylvania, New York, Massachusetts, New Jersey, Michigan and Maryland, and compared each with the others in its own state. In 32 of 45 such pairs the more crowded system was the costlier one, slightly more often than for how much of the system was new (30 of 45) or how much was cast iron (26 of 44). New York supplies 21 of those pairs; without it, crowding and newness tie at 16 of 24. The four most crowded systems, Philadelphia Gas Works, National Grid’s New York City system, Peoples Gas and Con Edison, each rank in the top three of their states.
But crowding can’t explain Chicago’s old premium, and the reason is a utility most Chicagoans never deal with. North Shore Gas serves Chicago’s northern suburbs, a system about as crowded as Nicor’s, 16.1 miles of main per 1,000 lines against 16.4. It belongs to the same parent company as Peoples Gas, WEC Energy Group. And from 2004 through 2015, on our measure, it cost its customers within $80 a year of what Peoples Gas cost Chicago’s customers. Crowding alone can’t explain an old premium that a suburban sister utility shared.
How old are Chicago’s gas pipes?
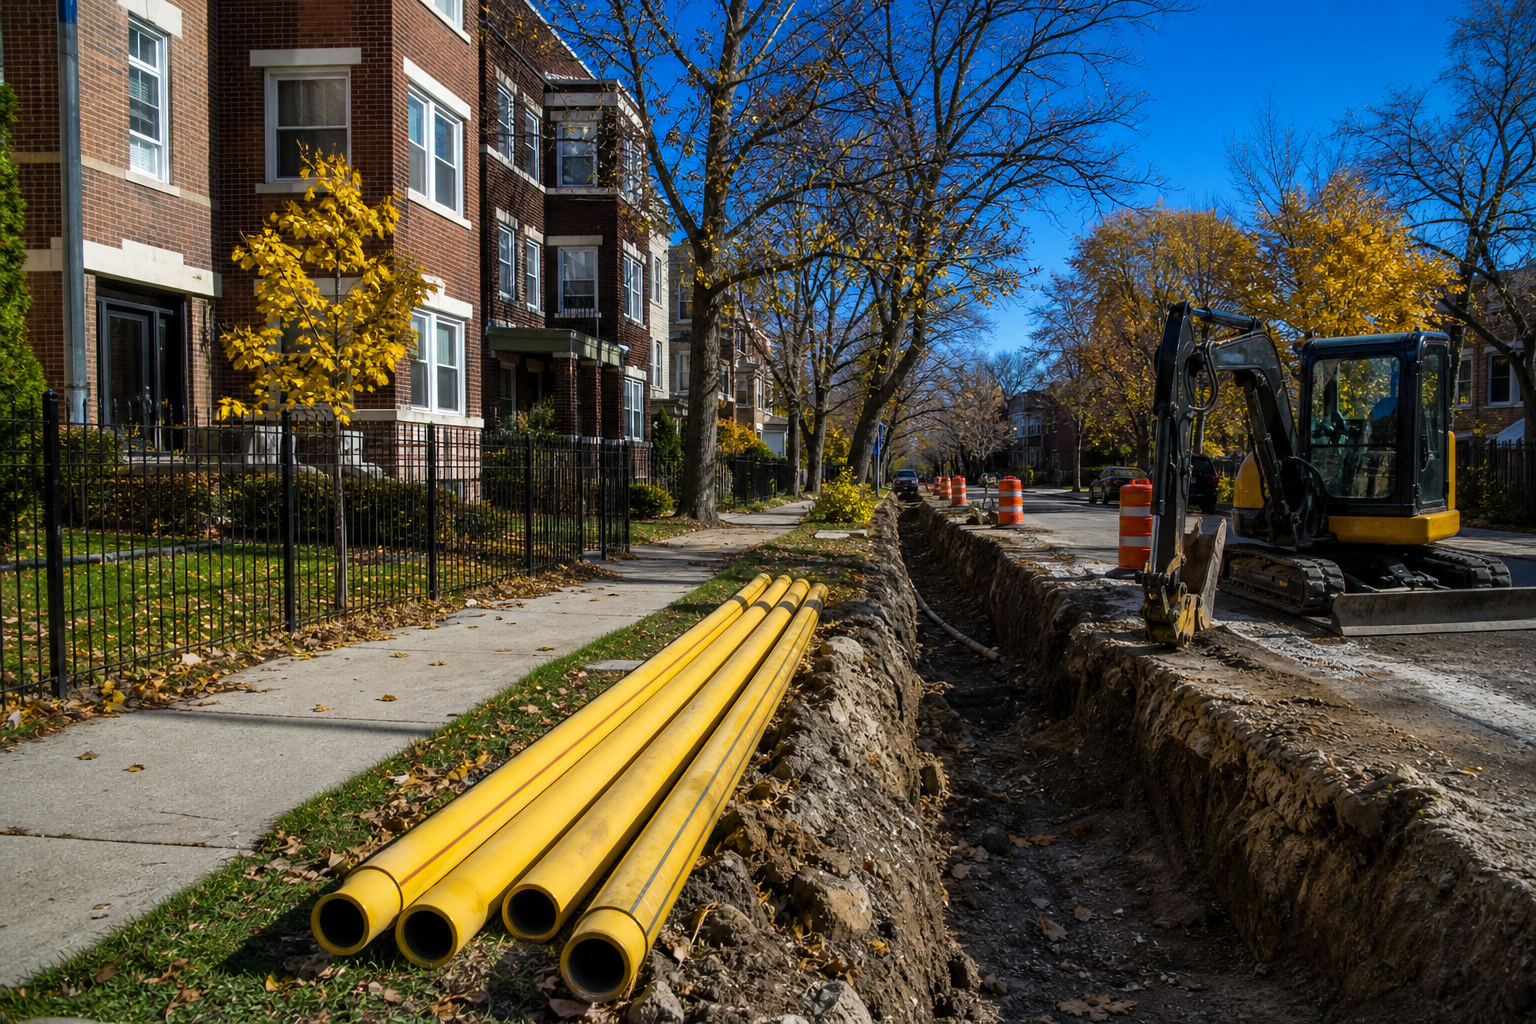
About one mile in seven is older than World War II: 644 of Peoples Gas’s 4,701 miles of main were laid before 1940, by its 2025 federal report. In 2004 it reported 1,734 miles of cast-iron main out of 3,991, 43 percent of the system. Cast iron and ductile iron are what the Illinois Commerce Commission (ICC), the state’s utility regulator, calls high-risk, leak-prone pipe. By 2025 the cast iron was down to 900 miles, 19 percent. Across the country, gas utilities reported about 40,700 miles of cast-iron main in 2004 and about 13,600 in 2025: the nation cut its cast iron by about 66 percent, Chicago by about 48. Peoples Gas had the fifth-largest inventory of any utility in 2004 and the sixth-largest in 2025.
The rebuild shows in the same reports. About a third of the mains Peoples Gas runs today, 1,559 miles, went into the ground in 2010 or later; for Nicor, North Shore Gas and Ameren the share is closer to one in ten.
What changed after the pipe surcharge?
Against Nicor, not much. Against its sister utility, a gap opens just as the surcharge climbs. In 2013, Public Act 98-0057 let Illinois gas utilities with more than 700,000 customers add a surcharge for pipe work outside a rate case, its growth capped at an annual average of 4 percent of delivery revenue, reset to zero each time new base rates took effect, and repealed at the end of 2023. Peoples Gas and Nicor were big enough to use it. North Shore Gas, with about 143,000 residential customers, was not.
Peoples Gas’s own monthly history shows its surcharge climbing: an average of 2.45 percent in 2015, 7.23 in 2016, 19.58 in 2019 and 33.57 in 2023. The percentage swings with the seasons and runs highest in summer, when bills are smallest, so the yearly averages overstate what a winter bill carried; the peak, 48.19 percent, came in August 2023. It went to zero in December 2023, after the ICC’s November order granted about $303 million of the $404 million Peoples Gas had asked for, set a 9.38 percent return on equity and paused the pipe program while it investigated. Small charges of the kind the law allows for settling up followed in 2024 and 2025, and a one-month credit of 34.96 percent in July 2026.
Now set the twins side by side. Through 2015 they stayed level, on our measure. In 2016, the year the surcharge first averaged more than a few percent, Peoples Gas pulled ahead by $130. The gap reached $198 in 2019 and averaged about $307 over 2021 and 2022, years when the timing of gas-cost recovery swings these figures, then eased to $223 by 2024.
Two things complicate it. About half of the split is North Shore getting cheaper, from $776 a year in 2004–2008 to $652 in 2019–2024, not Peoples getting dearer, from $775 to $908. And Nicor, which was also big enough to use the law, rose by about as much as Peoples, from $333 to $473, even though its customers’ use fell about 11 percent. And Chicago’s premium over Nicor was widest in 2014, $719, before the surcharge had started, and narrowest while the surcharge peaked: $312 in 2022 and $348 in 2023.
What happens next?
The pipe work has a deadline now. In February 2025 the ICC ended its investigation of what it called Peoples’ “long over-budget” System Modernization Program and ordered the utility to retire its cast- and ductile-iron pipe by 2035. The record, one member of the ICC said, shows Peoples Gas “was not prioritizing the removal” of that pipe, pursuing it as one part of the larger program, so the retirement rate “slowed over time.” The federal reports show the slowdown: Peoples Gas took out about 59 miles of iron main a year from 2014 to 2019, 45 a year from 2019 to 2024 and about 10 in 2025; the most in a single year was 2013, about 92 miles. With 1,068 miles left at the end of 2025, the deadline takes about 107 miles a year for ten years: 1.8 times the fastest five-year pace on the federal record and about 11 times last year’s.
That order neither approved nor denied any spending; what the work costs customers is settled in rate cases. One is open now, ICC docket 26-0065. Peoples Gas first asked for $202 million and later cut that to $144 million; a proposed order from the administrative law judges would allow $66.2 million, according to the Citizens Utility Board, and the ICC’s list of rate-case deadlines shows the case still open on November 16, 2026, with a deadline of December 3, 2026. More on that, and on this winter’s bills, is on our heating bills page.
Our theory: the surcharge split
Here is what we think is going on, and it is our theory, not a finding. Chicago’s long premium over Nicor’s suburbs doesn’t look like a city effect; Peoples Gas’s suburban sister carried it too, and these records can’t say where it comes from. What the last decade added is the surcharge. From 2016, as Peoples Gas’s pipe surcharge climbed, Chicago pulled away from the one sister utility too small to charge it, by about $223 a year in 2024.
- On the recordFor it: the twins cost within $80 of each other every year through 2015 and split in 2016, as the surcharge began to climb; and the law reached Peoples Gas and not North Shore.
- Not establishedAgainst it: about half the split is North Shore getting cheaper; the gap eased in 2023 and 2024, around and after the surcharge’s highest year; Chicago’s premium over Nicor shrank as the surcharge peaked; and Nicor, also big enough to use the law, rose about as much as Peoples. Whether Nicor charged its own surcharge isn’t in these records.
- Not establishedAlso unsettled: our measure prices all gas at the state’s average citygate cost, so a difference in what each utility paid for its own gas lands in the non-gas figure; and the federal filings don’t show how much of any utility’s spending was pipe work.
What would weaken it? The surcharge’s costs didn’t vanish in December 2023; they moved into base rates, and the pipe is still being paid for. So if the theory is right, the split shouldn’t close now that the surcharge line is gone. EIA posted the 2024 company filings on February 5, 2026; if the 2025 figures, on a similar schedule, put the gap back near the pre-2016 band, within about $80, something other than the surcharge was driving it, and the theory is in trouble.
What these records can’t tell you
- On the recordWhat each utility collected per residential customer and how much gas they used, as filed with EIA, 2004 to 2024; how much of each system is iron and how old it is, as filed with the federal pipeline-safety agency.
- Not establishedYour bill. These are averages over hundreds of thousands of customers.
- Not establishedWhy Peoples Gas and North Shore Gas both cost more than Nicor from 2004 to 2015. Rate design, corporate costs and history are candidates; the filings don’t separate them.
- Not establishedHow much the pipe program cost or whether it was worth it. Those are argued in the ICC’s dockets.
How we counted
- Utility figures. EIA Form 176 filings for Peoples Gas, North Shore Gas and Nicor Gas, 2004 to 2024, for Ameren Illinois, 2019 to 2024, and for 26 utilities in seven states, 2019 to 2024: residential sales customers, volume and revenue. The form’s instructions require revenue to include taxes and surcharges. Non-gas cost per customer is revenue minus the gas valued at the state’s citygate price for that year, divided by customers, in 2024 dollars. The citygate price is EIA’s monthly natural gas citygate price for each state (series N3050 plus the state’s code), averaged over each year with EIA’s monthly residential deliveries as weights; dollars are converted with the Bureau of Labor Statistics’ consumer price index for all urban consumers (CUUR0000SA0), annual averages. Peoples Gas revenue is first divided by 1.08 to remove Chicago’s 8 percent gas tax, per the Civic Federation’s 2026 guide; other utilities’ local taxes are left in. Five- and six-year periods smooth years when the timing of gas-cost recovery swings the figures, such as 2021 and 2022.
- Pipe. Gas distribution annual reports filed with the Pipeline and Hazardous Materials Safety Administration, 2004 to 2025, from Catalyst Cooperative’s archive of the agency’s files: miles of main by material and by decade installed, and service lines. National cast-iron totals are summed as filed and rounded; an operator can file more than one report. Iron means cast iron plus ductile iron.
- The seven-state check. For each pair of utilities in the same state, we asked whether the one that was more crowded (fewer miles of main per 1,000 service lines, 2024), newer (share of main installed since 2010) or more iron (cast-iron share, 2014) also had the higher non-gas cost in 2019–2024. Some pairs turn on small differences.
- The surcharge. Peoples Gas’s “History of Gas Charges” file, the qualifying infrastructure plant percentage by month, from the current file and five copies kept by the Internet Archive between 2015 and 2023. The copies leave out September to December 2017, so 2017’s average covers eight months. Yearly figures are averages of the monthly percentages, not weighted by revenue.
- Documents. Public Act 98-0057; the ICC’s releases of November 16, 2023 and February 20, 2025; the ICC’s rate-case deadlines; Peoples Gas on its revised rate request; the Citizens Utility Board on the proposed order; the Civic Federation’s 2026 consumer tax guide; EIA Form 176 instructions.
ON AMAZON
For keeping track of the heat
- Amazon Smart Thermostat for Home. A WiFi thermostat that works with Alexa.
- Honeywell Home RTH9585WF1004 Wi-Fi Smart Color Thermostat. A seven-day programmable Wi-Fi thermostat with a touch screen.
- Antonki 2 Pack Room Thermometer Indoor Hygrometer with Max/Min Record. Two indoor thermometers that keep each day’s high and low.
- TempPro TempAir 500 FT Indoor Outdoor Thermometer Wireless with Sensor. A wireless thermometer with an outdoor sensor.
Browse Amazon
- Amazon Best Sellers. Amazon’s list of its most popular products, by category.
As an Amazon Associate I earn from qualifying purchases.
Computed by KCM Desk from EIA, federal pipeline-safety and Peoples Gas records and ICC documents, read November 16, 2026. Human-guided and edited — about this desk. If you spot an error, corrections come first.
Related Keep Chicagoland Moving coverage
- Chicago Heating Bills This Winter: Heating Oil Is Up 59 Percent, but About One Chicago Home in 1,400 Heats With Fuel Oil or Kerosene. For the 78 Percent on Gas, the Midwest Forecast Is a Smaller Bill, and in Illinois the Gas Is Now 37 Percent of the Price
- Chicago’s 811 File Holds 14,508 Utility-Hit Reports Since 2015. Gas Leads — and 846 Reports Record What Was Hit as UNKNOWN.
- 7 Things Under Chicago, by the Record: Raised Streets, a Freight-Tunnel Flood — and Tunnels 300 Feet Down
- No State’s Residential Electricity Prices Rose Faster Than Illinois’: Up 28 Percent in a Year, Per the Federal Table