
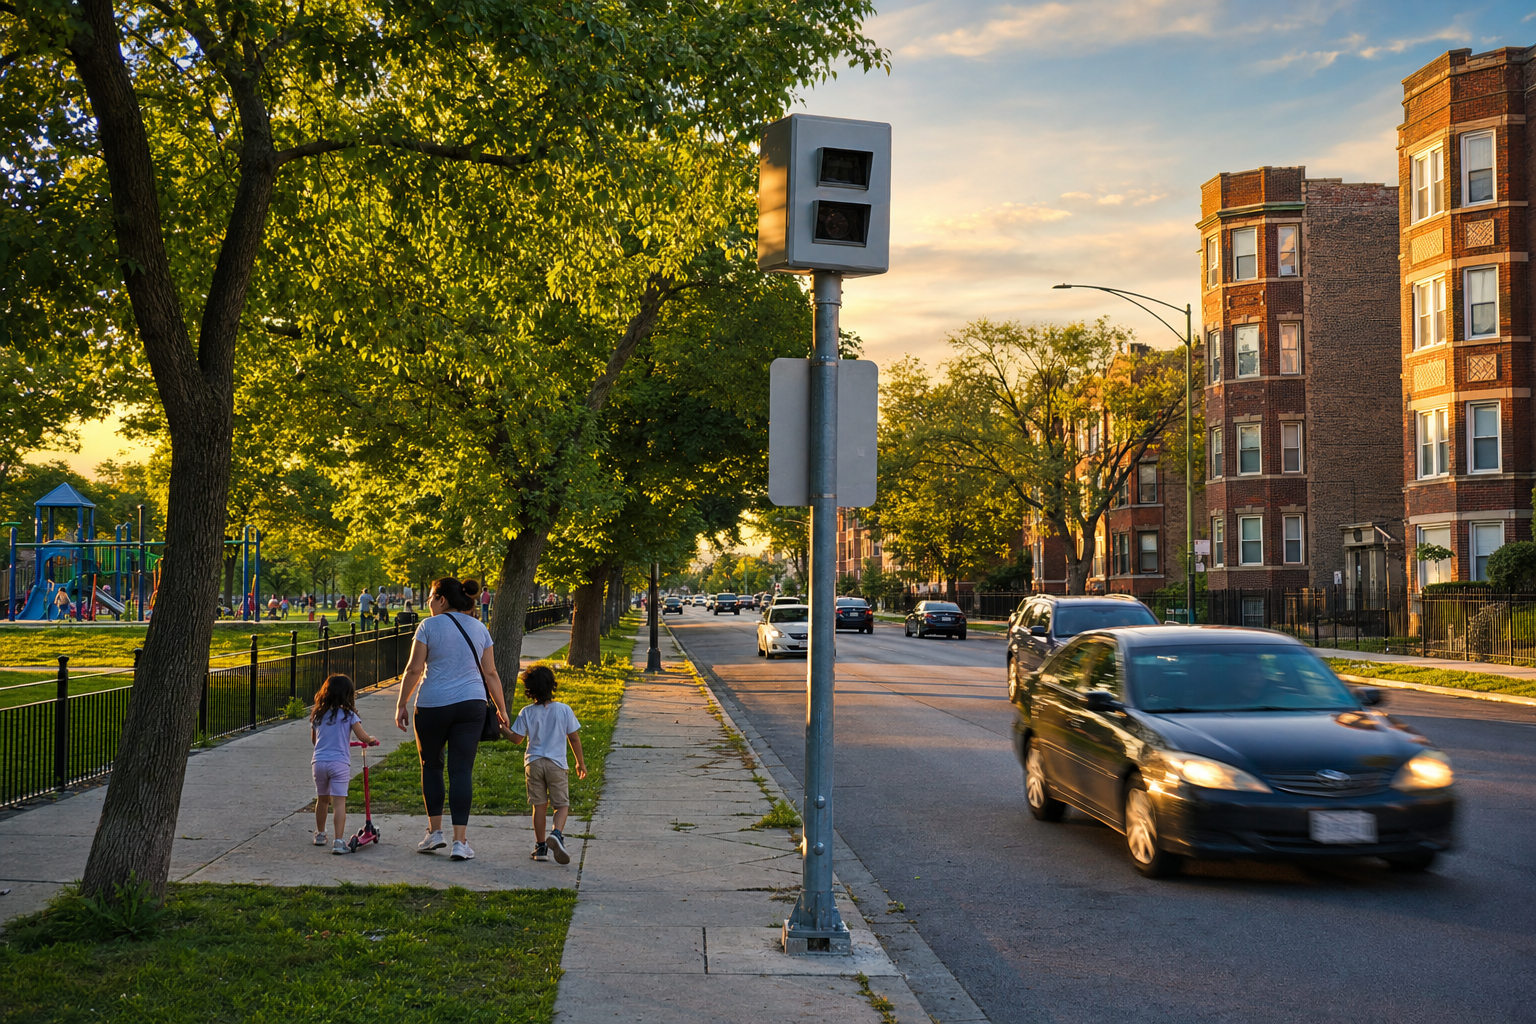

Chicago’s speed cameras have recorded 20.6 million violations since the program’s file begins in July 2014 — 2.6 million of them in the latest year on file — July 1, 2025 through June 29, 2026 — across 213 camera locations. The recording is anything but even: the busiest location, a single camera on Ashland Avenue beside McKinley Park, averaged 415 violations a day. And after the largest one-year jump in cameras recording violations, 2026 is running 17 percent ahead of last year.
490,578 daily camera records summed · program rules and the 2021 policy change taken from the city’s own pages, read in full · violations are camera recordings, not ticketsA speed camera here is part of the city’s Children’s Safety Zone program: radar-equipped cameras allowed within an eighth of a mile of a school or park, enforcing on school days near schools and during park hours near parks. One vocabulary rule before any numbers, straight from the dataset’s own description: a “violation” in this file is a capture by the camera and radar, reviewed by two city contractors — and the file includes violations that never became citations, as when the vehicle’s owner could not be identified. Every number below counts recorded violations, not tickets, and not dollars.
The 2021 cliff: a 4-mph change in the rules, four times the violations
The program ran its first seven years ticketing only vehicles 10 or more mph over the limit. On January 15, 2021, the city announced — read in full for this piece — that warnings would begin immediately for 6-to-10-mph-over speeding and $35 tickets would follow on March 1, citing a 45 percent rise in traffic deaths in 2020. The fine schedule since: $35 for 6 to 10 mph over, $100 for 11 and over. The file shows what that threshold was worth: 800,594 recorded violations in 2020, 3,077,604 in 2021. The count then eased each year — 2.73 million, 2.29 million, 2.24 million — a pattern consistent with drivers adjusting, though this file alone cannot say why.
More cameras recorded violations in 2025 than in any prior year
In 2024, 165 distinct cameras recorded at least one violation. In 2025 it was 213 — 48 more, the largest one-year increase in the file’s twelve years. The file has no installation inventory, so this counts cameras that recorded anything in a year — a rise in recording cameras, which is not the same as a verified count of new installations. Violations rose over the same period: 2,239,667 in 2024, 2,444,752 in 2025, and on matched January-through-June-29 windows — the file’s newest day is June 29 — 2026 stands at 1,165,238 against 992,384 last year, up 17 percent, and ahead of 2024’s pace as well.
Ten locations account for three violations in ten
Over the latest year on file — July 1, 2025 through June 29, 2026, 2,609,159 violations — the top ten of 213 camera locations recorded 31 percent of everything. The busiest locations: 3358 S Ashland Ave beside McKinley Park (151,057 — 415 a day on average), 5857 N Broadway in Edgewater (119,014), 10540 S Western Ave in Beverly (88,438), 2740 S Archer Ave in Bridgeport (77,233), and 2705 W Irving Park in Irving Park (69,216). The file records where cameras capture speeding, not why some corridors run so much hotter — road design, traffic volume and camera placement are all invisible to it, so this page makes no claim about causes.
- 3358 S ASHLAND AVEMcKinley Park151,057415
- 5857 N BROADWAYEdgewater119,014327
- 10540 S WESTERN AVEBeverly88,438243
- 2740 S ARCHER AVEBridgeport77,233212
- 2705 W IRVING PARKIrving Park69,216190
- 8550 S LAFAYETTE AVEChatham64,909178
- 445 W 127THWest Pullman62,484172
- 7133 N SHERIDAN RDRogers Park56,417155
- 2650 W PETERSON AVE / USWest Ridge55,228152
- 4909 N CICERO AVEAlbany Park54,938151
How we counted
- Source: the city’s Speed Camera Violations dataset (hhkd-xvj4), retrieved July 29, 2026: 490,578 rows, one per camera per day, each carrying that day’s violation count. We summed the counts — row counts alone would badly undercount. The file runs July 1, 2014 through June 29, 2026. The dataset says it withholds roughly the most recent two weeks for revisions; at retrieval the gap was about thirty days, so the newest weeks shown may still be revised.
- A violation is not a ticket: per the dataset’s description, violations are camera-and-radar captures reviewed by two separate city contractors, and the file includes violations never issued as citations. Every count on this page is recorded violations — the word ticket appears here only when describing the program’s fine rules — and there are no revenue estimates: the file contains no dollar amounts.
- Matched windows: year-over-year comparisons use January 1 through June 29 of each year, matching the file’s newest day, so no year gets more calendar than another.
- Cameras: “cameras recording” counts distinct camera IDs with at least one violation-day in the year — the file has no installation inventory. Two units appear on this page and they are kept separate: year-by-year camera counts are distinct camera IDs, while the rankings group rows by street address — 213 addresses carrying 215 camera IDs in the latest year, since a few addresses host two cameras. The top-ranked address, 3358 S Ashland Ave, carries a single camera ID in the file, so its figures are one camera’s. Addresses are shown exactly as the file records them, and community areas come from checking each location’s coordinates against the city’s official boundary file.
- Program rules: the Children’s Safety Zone rules — zone geography, enforcement hours, the first-offense warning, the 30-day warning period for new cameras, and the $35/$100 fine schedule — come from the city’s program page and its January 15, 2021 announcement, both read in full.
- What this is not: a safety analysis or a revenue story. Whether the cameras change crash outcomes is a separate question this file cannot answer; this is a count of what the cameras recorded.
Computed by KCM Desk from Chicago speed-camera records, July 2014 through June 29, 2026; published July 29, 2026. If you spot an error, corrections come first.
Related Keep Chicagoland Moving coverage
- Cameras Watching Chicagoland, by the Numbers
- The Chicago Speed Camera Locations That Record the Most Violations
- The Traffic Census Inside Chicago’s Enforcement Cameras: the Median Matched Segment Moved Just 0.4 Percent in a Year
- Chicago’s Red-Light Cameras Are the Quieter Program: 537,706 Violations in the Latest Year, Led by Lake Shore and Belmont
- At Least 116 Chicagoland Police Agencies Have Used Flock Plate Readers. One Suburb’s Cameras Can Be Searched by 463 Organizations.
- Riding the Red Line, 2001–2026: Every Station, One Scroll