After the Wrecking Ball: A Rebuild Permit Follows at 84 Percent of Logan Square’s Demolished Sites, and at None of West Pullman’s 137

Chicago issued wrecking permits at 4,482 sites in 2018-2022. We matched every one against the city's new-construction permits by parcel number and address: 42.8 percent show a rebuild permit. Logan Square, 187 of 222. West Englewood, 1 of 287. West Pullman, 0 of 137. Where a rebuild comes, the median gap is 50 days.

Between 2018 and 2022, Chicago issued wrecking permits at 4,482 distinct sites. What happened next depends almost entirely on where the site stands. We matched every one of those sites against the city’s new-construction permits, by parcel number and by address, and found a rebuild permit at 1,916 of them — 42.8 percent. In Logan Square, 187 of 222 demolition sites show one. In West Englewood, 1 of 287 does. In West Pullman, none of 137 do. Two very different things wear the same name in the permit file: on the North Side, demolition is mostly the first step of construction; on much of the South and West sides, no construction follows in the record. These rates are conservative estimates — the matching is built so that missing a real rebuild is far more likely than inventing one — and we report what the records show, taking no position on where anyone should live.

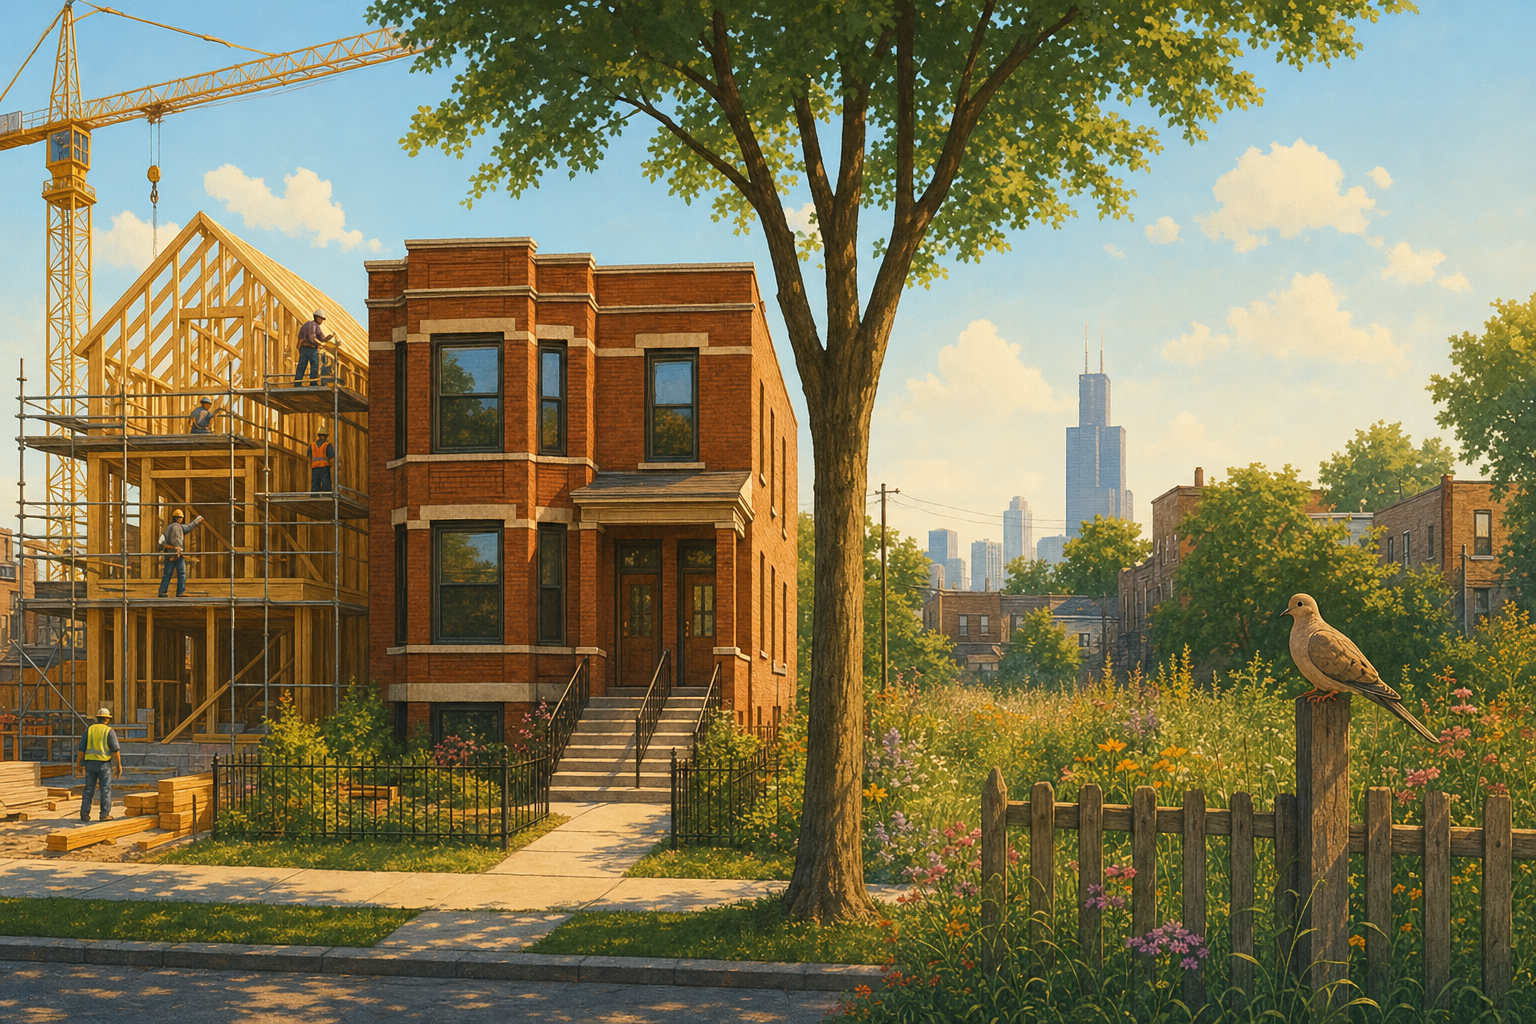
Two demolitions, two fates

After the wrecking ball: where a building permit follows 2018–22 demolition sites with a matched new-construction permit · lowest and highest 8 of 39 areas with 30+ sites · conservative matching, more below West PullmanWest Pullman: 0 of 137 demolition sites show a matched new-construction permit (0%)0% · 0 of 137West EnglewoodWest Englewood: 1 of 287 demolition sites show a matched new-construction permit (0.3%)0.3% · 1 of 287RoselandRoseland: 1 of 162 demolition sites show a matched new-construction permit (0.6%)0.6% · 1 of 162Greater Grand CrossingGreater Grand Crossing: 1 of 74 demolition sites show a matched new-construction permit (1.4%)1.4% · 1 of 74EnglewoodEnglewood: 4 of 237 demolition sites show a matched new-construction permit (1.7%)1.7% · 4 of 237South ChicagoSouth Chicago: 2 of 90 demolition sites show a matched new-construction permit (2.2%)2.2% · 2 of 90West Garfield ParkWest Garfield Park: 2 of 77 demolition sites show a matched new-construction permit (2.6%)2.6% · 2 of 77Auburn GreshamAuburn Gresham: 2 of 64 demolition sites show a matched new-construction permit (3.1%)3.1% · 2 of 64CITY OVERALLCITY OVERALL: 1,916 of 4,482 demolition sites show a matched new-construction permit (42.8%)42.8% · 1,916 of 4,482Logan SquareLogan Square: 187 of 222 demolition sites show a matched new-construction permit (84.2%)84.2% · 187 of 222North CenterNorth Center: 205 of 245 demolition sites show a matched new-construction permit (83.7%)83.7% · 205 of 245Lincoln SquareLincoln Square: 74 of 89 demolition sites show a matched new-construction permit (83.1%)83.1% · 74 of 89Albany ParkAlbany Park: 29 of 35 demolition sites show a matched new-construction permit (82.9%)82.9% · 29 of 35Irving ParkIrving Park: 96 of 116 demolition sites show a matched new-construction permit (82.8%)82.8% · 96 of 116Lincoln ParkLincoln Park: 182 of 226 demolition sites show a matched new-construction permit (80.5%)80.5% · 182 of 226West TownWest Town: 218 of 286 demolition sites show a matched new-construction permit (76.2%)76.2% · 218 of 286Lake ViewLake View: 209 of 276 demolition sites show a matched new-construction permit (75.7%)75.7% · 209 of 276

The split is not a gradient; it is a cliff. Eight community areas — West Pullman, West Englewood, Roseland, Greater Grand Crossing, Englewood, South Chicago, West Garfield Park, and Auburn Gresham — together account for more than a thousand demolition sites and, among them, fewer than fifteen matched rebuild permits. At the other end, six North and Northwest side areas each cleared 80 percent. The pattern echoes what our West Englewood profile found from the other direction: a nearly empty new-construction permit record, next to one of the citywide-fastest price rises. What stands on those sites today, the permit file cannot say; what it can say is that construction was almost never permitted on them.

When the rebuild comes, it comes fast

Among sites that do rebuild, the timeline is short. 516 of the 1,916 matched sites had their new-construction permit in hand before the wrecking permit — developer projects staged in the usual order, build permit first. Among the 1,400 where the construction permit came after the demolition, the median gap was just 50 days, and three-quarters were under 204 days. Only 91 sites took more than three years. Rebuilding, where it happens, is mostly one continuous project. What the file does not show, within the record so far, is a reservoir of demolished sites slowly filling in years later — though the latest 2022 demolitions have had the least time to do so, and later permits would raise these rates.

The map

Where demolition means replacement Share of 2018-22 demolition sites with a matched rebuild permit; gray under the 30-site floor under 10%about the city’s 43%over 60%over 75% Albany Park: 29 of 35 demolition sites show a matched new-construction permit (82.9%)Archer Heights: fewer than 30 demolition sites in the 2018-22 cohort, so not rankedArmour Square: fewer than 30 demolition sites in the 2018-22 cohort, so not rankedAshburn: fewer than 30 demolition sites in the 2018-22 cohort, so not rankedAuburn Gresham: 2 of 64 demolition sites show a matched new-construction permit (3.1%)Austin: 16 of 104 demolition sites show a matched new-construction permit (15.4%)Avalon Park: fewer than 30 demolition sites in the 2018-22 cohort, so not rankedAvondale: 54 of 80 demolition sites show a matched new-construction permit (67.5%)Belmont Cragin: fewer than 30 demolition sites in the 2018-22 cohort, so not rankedBeverly: fewer than 30 demolition sites in the 2018-22 cohort, so not rankedBridgeport: 52 of 73 demolition sites show a matched new-construction permit (71.2%)Brighton Park: fewer than 30 demolition sites in the 2018-22 cohort, so not rankedBurnside: fewer than 30 demolition sites in the 2018-22 cohort, so not rankedCalumet Heights: fewer than 30 demolition sites in the 2018-22 cohort, so not rankedChatham: 2 of 31 demolition sites show a matched new-construction permit (6.5%)Chicago Lawn: 2 of 43 demolition sites show a matched new-construction permit (4.7%)Clearing: fewer than 30 demolition sites in the 2018-22 cohort, so not rankedDouglas: fewer than 30 demolition sites in the 2018-22 cohort, so not rankedDunning: fewer than 30 demolition sites in the 2018-22 cohort, so not rankedEast Garfield Park: fewer than 30 demolition sites in the 2018-22 cohort, so not rankedEast Side: fewer than 30 demolition sites in the 2018-22 cohort, so not rankedEdgewater: 26 of 40 demolition sites show a matched new-construction permit (65.0%)Edison Park: fewer than 30 demolition sites in the 2018-22 cohort, so not rankedEnglewood: 4 of 237 demolition sites show a matched new-construction permit (1.7%)Forest Glen: fewer than 30 demolition sites in the 2018-22 cohort, so not rankedFuller Park: 4 of 41 demolition sites show a matched new-construction permit (9.8%)Gage Park: fewer than 30 demolition sites in the 2018-22 cohort, so not rankedGarfield Ridge: fewer than 30 demolition sites in the 2018-22 cohort, so not rankedGrand Boulevard: fewer than 30 demolition sites in the 2018-22 cohort, so not rankedGreater Grand Crossing: 1 of 74 demolition sites show a matched new-construction permit (1.4%)Hegewisch: fewer than 30 demolition sites in the 2018-22 cohort, so not rankedHermosa: fewer than 30 demolition sites in the 2018-22 cohort, so not rankedHumboldt Park: 22 of 72 demolition sites show a matched new-construction permit (30.6%)Hyde Park: fewer than 30 demolition sites in the 2018-22 cohort, so not rankedIrving Park: 96 of 116 demolition sites show a matched new-construction permit (82.8%)Jefferson Park: 26 of 36 demolition sites show a matched new-construction permit (72.2%)Kenwood: fewer than 30 demolition sites in the 2018-22 cohort, so not rankedLake View: 209 of 276 demolition sites show a matched new-construction permit (75.7%)Lincoln Park: 182 of 226 demolition sites show a matched new-construction permit (80.5%)Lincoln Square: 74 of 89 demolition sites show a matched new-construction permit (83.1%)Logan Square: 187 of 222 demolition sites show a matched new-construction permit (84.2%)Loop: fewer than 30 demolition sites in the 2018-22 cohort, so not rankedLower West Side: 39 of 57 demolition sites show a matched new-construction permit (68.4%)McKinley Park: fewer than 30 demolition sites in the 2018-22 cohort, so not rankedMontclare: fewer than 30 demolition sites in the 2018-22 cohort, so not rankedMorgan Park: 4 of 42 demolition sites show a matched new-construction permit (9.5%)Mount Greenwood: 23 of 33 demolition sites show a matched new-construction permit (69.7%)Near North Side: 28 of 54 demolition sites show a matched new-construction permit (51.9%)Near South Side: fewer than 30 demolition sites in the 2018-22 cohort, so not rankedNear West Side: 72 of 142 demolition sites show a matched new-construction permit (50.7%)New City: 8 of 128 demolition sites show a matched new-construction permit (6.2%)North Center: 205 of 245 demolition sites show a matched new-construction permit (83.7%)North Lawndale: 4 of 104 demolition sites show a matched new-construction permit (3.8%)North Park: fewer than 30 demolition sites in the 2018-22 cohort, so not rankedNorwood Park: 28 of 41 demolition sites show a matched new-construction permit (68.3%)Oakland: no dataO’Hare: fewer than 30 demolition sites in the 2018-22 cohort, so not rankedPortage Park: 18 of 33 demolition sites show a matched new-construction permit (54.5%)Pullman: fewer than 30 demolition sites in the 2018-22 cohort, so not rankedRiverdale: fewer than 30 demolition sites in the 2018-22 cohort, so not rankedRogers Park: fewer than 30 demolition sites in the 2018-22 cohort, so not rankedRoseland: 1 of 162 demolition sites show a matched new-construction permit (0.6%)South Chicago: 2 of 90 demolition sites show a matched new-construction permit (2.2%)South Deering: fewer than 30 demolition sites in the 2018-22 cohort, so not rankedSouth Lawndale: 8 of 40 demolition sites show a matched new-construction permit (20.0%)South Shore: 3 of 46 demolition sites show a matched new-construction permit (6.5%)Uptown: 43 of 59 demolition sites show a matched new-construction permit (72.9%)Washington Heights: fewer than 30 demolition sites in the 2018-22 cohort, so not rankedWashington Park: fewer than 30 demolition sites in the 2018-22 cohort, so not rankedWest Elsdon: fewer than 30 demolition sites in the 2018-22 cohort, so not rankedWest Englewood: 1 of 287 demolition sites show a matched new-construction permit (0.3%)West Garfield Park: 2 of 77 demolition sites show a matched new-construction permit (2.6%)West Lawn: fewer than 30 demolition sites in the 2018-22 cohort, so not rankedWest Pullman: 0 of 137 demolition sites show a matched new-construction permit (0.0%)West Ridge: 21 of 35 demolition sites show a matched new-construction permit (60.0%)West Town: 218 of 286 demolition sites show a matched new-construction permit (76.2%)Woodlawn: 13 of 30 demolition sites show a matched new-construction permit (43.3%)

Meanwhile, demolition itself is slowing

The wrecking ball itself is slowing Wrecking/demolition permits issued per year (2026 partial year excluded) 4008001,2001,60020062010201420182022 2006: 1,446 demolition permits issued2007: 1,366 demolition permits issued2008: 965 demolition permits issued2009: 871 demolition permits issued2010: 1,150 demolition permits issued2011: 1,151 demolition permits issued2012: 1,557 demolition permits issued2013: 1,443 demolition permits issued2014: 1,232 demolition permits issued2015: 1,210 demolition permits issued2016: 1,305 demolition permits issued2017: 1,212 demolition permits issued2018: 1,144 demolition permits issued2019: 1,081 demolition permits issued2020: 738 demolition permits issued2021: 888 demolition permits issued2022: 785 demolition permits issued2023: 615 demolition permits issued2024: 635 demolition permits issued2025: 661 demolition permits issued

The city issued 1,446 demolition permits in 2006 and 661 in 2025 — a long slide with a floor around 615 to 660 a year since 2023. Our two-to-six-flat analysis found the city’s small apartment buildings disappearing through both demolition and deconversion; this file shows the demolition half of that pipeline running at less than half its mid-2000s pace. Fewer teardowns, but the ones that happen still sort sharply by geography.

How we counted

  • Source: City of Chicago Building Permits (ydr8-5enu), pulled August 3, 2026. Cohort: all 4,636 wrecking/demolition permits issued 2018 through 2022, collapsed to 4,482 unique sites by parcel number (multiple wreck permits at one parcel — front and rear buildings, phased work — count once, keeping the earliest date).
  • The match: a site counts as rebuilding if any new-construction permit (2017 to present) shares a parcel PIN with it or matches its normalized street address exactly, with an issue date no earlier than 365 days before the demolition permit. That look-back window exists because developers often pull the construction permit first; matches that predate the demolition by more than a year are not counted. 516 matched sites had the construction permit before the wrecking permit under this rule.
  • Why these undercount: about a third of new-construction permits carry no parcel number, and address matching misses street-number ranges and corner lots with two frontages. A missed match makes a rebuilt site look unrebuilt; the reverse error is far less likely, though parcel renumbering or address quirks could in principle produce a false match. Read each rate as a conservative estimate, more likely to understate rebuilding than overstate it.
  • The floor on areas: community areas with fewer than 30 demolition sites in the cohort (37 of them) are unranked and gray on the map.
  • What this is not: a permit is not a completed building — a matched site means construction was permitted, not that it finished. The file also does not say who demolished a building or why, and a demolition permit is not a record of abandonment: teardowns for luxury construction and emergency demolitions of failing buildings look identical here.

Computed by KCM Desk from records current to August 3, 2026; published August 3, 2026. If you spot an error, corrections come first.

Moving HereLiving HereCity in MotionNeighborhoods & Suburbs
About · Editorial Policy · Our Data & Methods · Privacy · Terms · Contact
© 2026 Keep Chicagoland Moving · A TAK Marketing, LLC publication · Part of the fabulous Omnishun information systems