
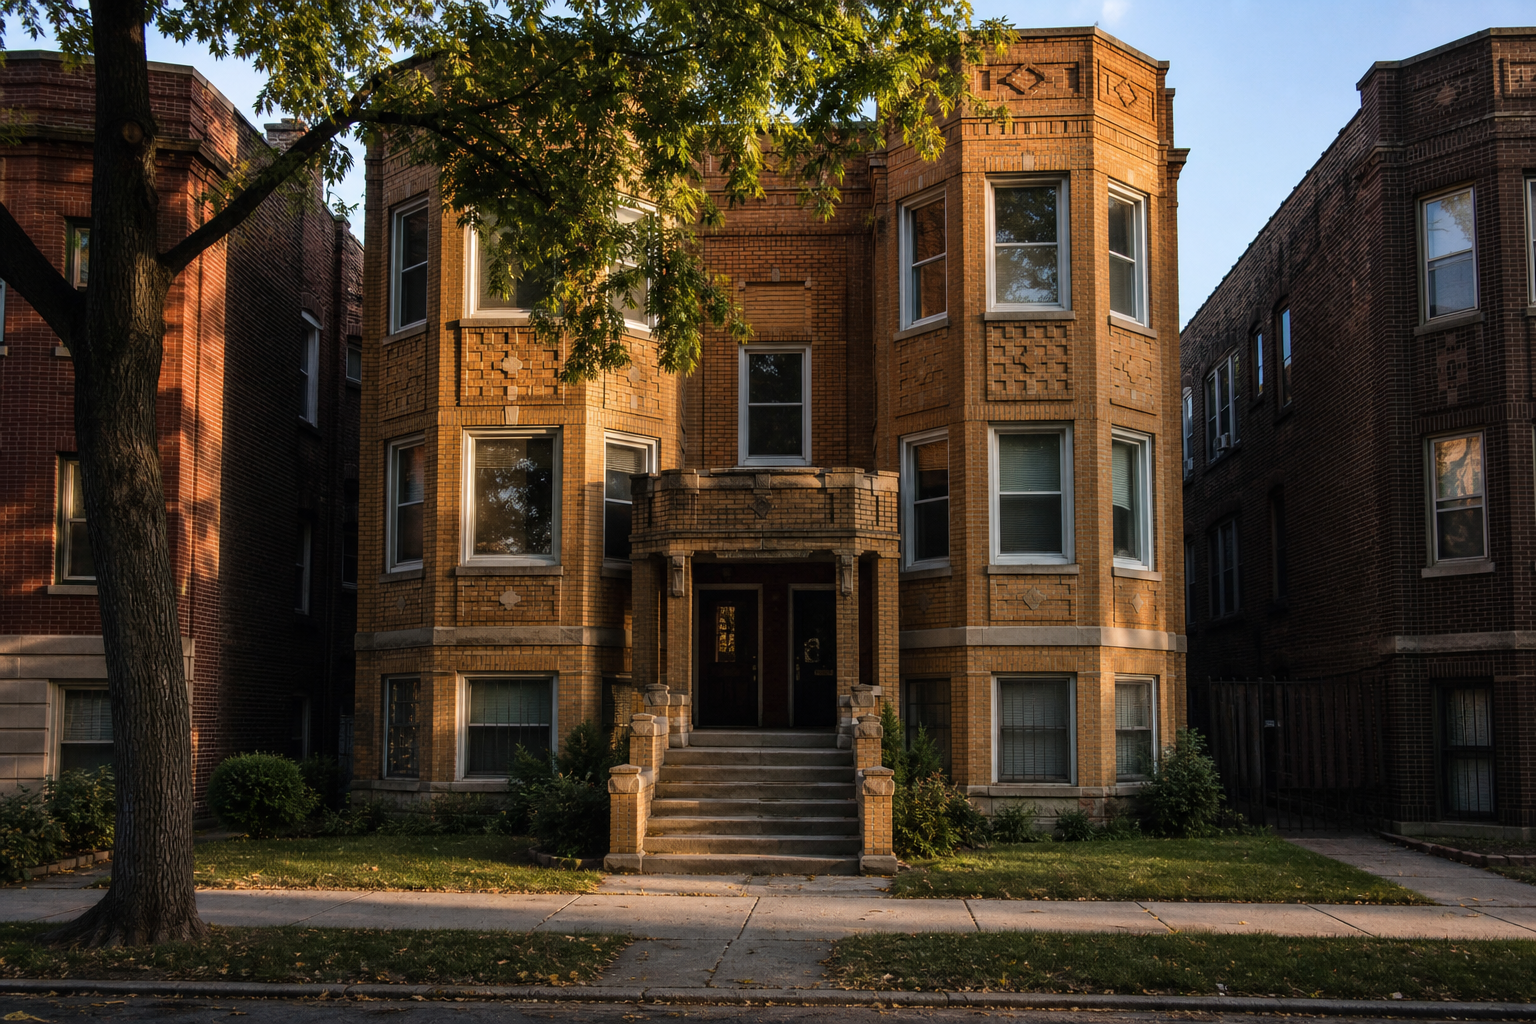

Chicago’s tax rolls show 7,875 fewer two-to-six-flats than in 2006, and almost half of the 13,049 parcels that left the count, 6,208, are now classed as single-family houses. Another 2,729 are classed as vacant land, and 2,084 had their parcel numbers retired, with condominium units now recorded within 12 meters of the same spot.
Cook County Assessor Parcel Universe, tax years 2006 to 2026, Chicago’s eight townships · recorded sales since 2018 · computed September 30, 2026The 7,875 is a net figure: 13,049 parcels, the numbered lots on the county’s tax rolls, stopped being classed as two-to-six-flats and 5,174 others joined the class. A two-to-six-flat is a small apartment building with two to six units, the Cook County Assessor’s class 211. The count has fallen every year since 2006, from 127,818 to 119,943, and the loss has slowed: 243 a year over the last five years, down from 505 a year between 2011 and 2016. This page follows every parcel that was a two-to-six-flat in 2006 to see what it is today.
Correction, September 30, 2026: this page was published on July 18, 2026 under a headline that said Chicago loses a two-to-six-flat every day, and it said the loss had run at nearly the same pace for twenty years. The twenty-year average is about one a day, 394 a year. The pace was not steady: the count fell by 505 a year between 2011 and 2016 and by 243 a year over the last five years, with 134 and 149 in the two most recent. The first version also said its records could not show where the buildings went; the section on that below is new. Its 2026 count, 119,904, is now 119,943 on the county’s current roll. And its buyer figures counted trustees of land trusts as companies; with trustees counted as trusts, North Center’s company share of purchases of flats in 2024–25 is 43 percent where the first version said 45. Area prices for 2025 also moved as the county recorded more sales: Woodlawn’s median flat for that year, $512,000 in the first version, is $462,000 on 97 sales.
The count: 127,818 in 2006, 119,943 in 2026
The count fell in each of the twenty years, by 7,875 in all. Is that one a day? On average, yes: 394 a year. The pace was uneven. In five-year blocks the count fell by 378 a year from 2006 to 2011, 505 a year from 2011 to 2016, 449 a year from 2016 to 2021 and 243 a year from 2021 to 2026. The largest drop in a single year was 716, from 2017 to 2018, and the two most recent years show 134 and 149, fewer than three a week. The only year as slow as those was 2009 to 2010, at 107.
The city’s demolition permits also fell in the years the permit data covers here, from 1,144 issued in 2018 to 661 in 2025, for buildings of every kind. The permit file has no field for the type of building, so it cannot say how many of those were two-to-six-flats. Our analysis of what follows a demolition reads those permits area by area.
The reason to count this building type is its rents. DePaul University’s Institute for Housing Studies describes two-to-four-unit buildings as the rental housing most likely to offer lower rents and family-sized apartments in Chicago. The count here is of parcels, each holding one building of two to six units. The Assessor’s class does not say how many units each building has, so this page cannot turn buildings into apartments.
Where the 13,049 went
- Single-family housesThe parcel is now classed as a one-unit house or townhouse.6,208
- Vacant landThe parcel is now classed as land with no building.2,729
- Condominium unitsThe building’s parcel number was retired and condominium units are recorded within 12 meters of the spot.2,084
- Tax-exempt propertyOwned by a government body, church, school or other exempt owner.710
- Apartment buildings of seven or more unitsReclassified into the county’s classes for larger buildings.566
- Mixed-use buildings of six units or fewerApartments with a storefront or other commercial space.352
- Everything elseCommercial or other classes, garages, and parcels not found at the same spot.400
Of the 127,818 parcels that were two-to-six-flats in 2006, 114,325 still are. Another 444 are still two-to-six-flats under a new parcel number. That leaves 13,049 that left the count, and the list above says what each is now. Houses are the largest group by a wide margin, 47.6 percent. Vacant land is 20.9 percent and condominium units 16.0 percent.
Each line is a change of class, and the class is the Assessor’s description of what is on the parcel. Where this page says a flat became a house, it means that change of class. A two-flat classed today as a single-family house may have been rebuilt as one house or replaced by a new one, and some reclassifications correct an older record and involve no construction. The file does not separate those. A parcel classed as vacant land has no building on the Assessor’s record today. When a building becomes condominiums the county retires its parcel number and issues one for each unit, so those were found by location: condominium units recorded within 12 meters of where the two-to-six-flat stood. The record does not say whether those units are in the old building or in a new one on the same lot.
Is a share that large plausible? The DePaul institute followed Chicago’s two-to-four-unit buildings from 2013 to 2019 and reported in 2021 that 47.5 percent of those lost had been replaced by a single-family home. The figure here, for two-to-six-unit buildings over twenty years, is 47.6 percent. The institute could not follow buildings whose parcel numbers changed, which it said were often condominiums. Matching by location, as this page does, places 2,084 of the lost flats at sites that now hold condominium units.
The count also gained parcels. Setting aside the 444 renumbered buildings, 5,174 parcels are two-to-six-flats in 2026 that were not in 2006: 2,656 were classed as single-family houses then, 761 were vacant land, and 736 carry parcel numbers that did not exist in 2006. The rest were mixed-use buildings, exempt property and other classes. Houses, then, moved in both directions: 6,208 flats became houses and 2,656 houses became flats, a net of 3,552 toward houses. The 7,875 in the headline is what is left after every gain is set against every loss.
In higher-priced areas, 61 percent of lost flats are now houses. In lower-priced areas, 55 percent are vacant land.
Split the city’s community areas at the citywide median house price, $320,000 in 2025. In the 39 areas at or above it, 8,622 flats left the count: 61 percent are now classed as houses, 23 percent were replaced by condominium units and 4 percent are vacant land. In the 33 areas below it, 4,182 left the count: 55 percent are vacant land, 21 percent houses and 2 percent condominium units. The higher-priced areas also lost a larger share of what they had, 13 percent of their 2006 flats against 7 percent. Four areas had fewer than 20 house sales in 2025 and are in neither group, and the Loop had no two-to-six-flats in either year. The split is an association between two records. It does not show that prices caused any one change.
- Lincoln Park940 of 2,503 flats of 2006 left the count. Largest group: houses, 607.38%
- North Center1,087 of 3,238 flats of 2006 left the count. Largest group: houses, 918.34%
- Lake View1,113 of 3,877 flats of 2006 left the count. Largest group: houses, 683.29%
- Washington Park140 of 542 flats of 2006 left the count. Largest group: larger buildings, 37.26%
- Grand Boulevard236 of 992 flats of 2006 left the count. Largest group: houses, 133.24%
- Douglas72 of 309 flats of 2006 left the count. Largest group: houses, 51.23%
- Fuller Park70 of 322 flats of 2006 left the count. Largest group: vacant land, 58.22%
- West Town1,347 of 6,524 flats of 2006 left the count. Largest group: houses, 647.21%
- Uptown174 of 875 flats of 2006 left the count. Largest group: condominiums, 71.20%
- Englewood588 of 3,030 flats of 2006 left the count. Largest group: vacant land, 358.19%
In Lincoln Park, 940 of the 2,503 two-to-six-flats of 2006 are no longer flats, 38 percent, and 607 of them are now houses. In North Center it is 1,087 of 3,238, with 918 now houses. Five areas, North Center, Lake View, West Town, Lincoln Park and Logan Square, account for 3,421 of the 6,208 flats that became houses citywide, and four of those five have the most sites that now hold condominium units, with West Town first at 530. In all five the median house sold for more than twice the citywide $320,000 in 2025.
In the five areas where the most flats became vacant land, Englewood, West Englewood, New City, North Lawndale and West Garfield Park, the median house sold for less than the citywide figure. In Englewood, 588 of 3,030 flats left the count and 358 of them are vacant land; 42 became houses. In West Englewood, 374 left the count and 273 are vacant land, and in Fuller Park 58 of the 70 that left are vacant land. The DePaul institute’s 2021 report found the same split for 2013 to 2019: replacement by single-family homes in higher-cost North and Northwest Side areas, and demolition followed by vacant land in lower-cost ones. The parcel record through 2026 agrees with it.
Not every area lost flats: 25 community areas have more two-to-six-flats in 2026 than in 2006, led by Portage Park, up 93, and Belmont Cragin, up 75.
Prices: the median two-to-six-flat sold for $445,000 in 2025
The median recorded sale of a two-to-six-flat in Chicago was $274,500 in 2019 and $445,000 in 2025, up 62 percent. Houses rose 39 percent over the same years and condominiums 26 percent, so flats rose fastest of the three. Among the 46 community areas with at least 20 sales of flats in both years, nine of the ten largest increases were in areas that started below the citywide median. The largest was West Englewood’s, from $63,000 to $220,000. North Lawndale’s median went from $175,000 to $377,500 and Woodlawn’s from $190,000 to $462,000. Our analysis of recorded sale prices has every area.
Buyers: companies bought 27 percent of the flats sold in 2024–25
Of the 8,808 two-to-six-flats sold in 2024 and 2025, 27 percent went to a buyer with a company name, up from 24 percent in 2018 and 2019. That is the highest of the three home types in the sales file: the figure for houses is 16 percent and for condominiums 6. The three highest area shares are on the North Side, in Lincoln Park, Uptown and North Center. In Lincoln Park companies bought 85 of the 173 flats sold in those two years, 49 percent, and in North Center 65 of 151, 43 percent, up from 25. On the South Side the shares were already high and did not move: 38 percent in both periods in South Shore and 35 percent in both in Greater Grand Crossing. A buyer counted as a company has a name with a marker such as LLC, Inc. or Corp.; trustees of land trusts are counted as trusts.
Do the buyers and the conversions connect? Lincoln Park and North Center are the two areas where the largest share of flats became something else, mostly houses, and they are two of the three areas where companies buy the largest share of the flats that sell. Our reading is that builders who replace flats with houses may account for some of those company purchases. The deeds do not record what a buyer does next, so this page cannot tie any one purchase to any one conversion. Our page on the buyer names has the method and the largest buyers.
What the parcel record does not show
A class is the Assessor’s description, and it can change because the record was corrected while nothing was built or torn down; the file does not mark which changes are corrections. The 710 parcels that are now tax-exempt show who owns the property and nothing about what stands on it. For 103 of the parcels that left the count, 60 of them in Englewood, no parcel was found at the same spot.
Each yearly figure dates the change in the record, which can come after the change on the ground. The county reassesses Chicago every three years, most recently in 2018, 2021 and 2024, and the largest one-year drop falls in one of those years. The five-year blocks are the steadier measure, and they show the same slowdown. The 2026 roll is not final either: the same count read in July was 119,904, 39 fewer than today.
The buyer figures come from the names on recorded deeds. A company name shows how the buyer is organized. It does not show what the buyer plans for the building. The county is still adding sales dated 2025 to its file, so the prices and buyer shares for that year can change, and they get another reading in January 2027.
- The count Cook County Assessor, Parcel Universe (nj4t-kc8j): parcels of class 211, apartment buildings of two to six units, in Chicago’s eight townships, for every tax year from 2006 to 2026.
- Following each parcel Each of the 127,818 parcel numbers that were class 211 in 2006 was looked up among the 882,584 Chicago parcels of 2026. Where the number still exists, its 2026 class is what this page reports. Where the number was retired, the 2026 parcels recorded within 12 meters of the 2006 location were read in its place. A retired number is assigned to a community area by the other parcels on its block.
- The groups Single-family houses: classes 202 to 210, 234, 278 and 295. Vacant land: 100, 190, 200 and 241. Condominium units: 299 and 399. Mixed-use buildings of six units or fewer: 212. Apartment buildings of seven or more units: the 300 classes other than 399. Tax-exempt: EX.
- Prices and buyers Cook County Assessor, Parcel Sales (wvhk-k5uv), as updated September 15, 2026: recorded sales of class 211 buildings since January 2018 that pass the Assessor’s arms-length screens and cover a single parcel, each placed in a community area by its parcel’s coordinates. Area medians need 20 or more sales in the year. Buyer names are sorted by pattern, in this order: banks and government bodies, trusts and trustees, companies, and people. Area buyer shares need 40 or more sales of flats in each two-year period.
- Demolition permits City of Chicago building permits (ydr8-5enu), permit type wrecking and demolition, every building type, by year of issue.
Computed by KCM Desk from the Cook County Assessor’s parcel and sales files and city permit data read September 30, 2026. First published July 18, 2026; recomputed and rewritten September 30, 2026. Human-guided and edited — about this desk. If you spot an error, corrections come first.
Related Keep Chicagoland Moving coverage
- Chicago Housing, by the Numbers
- The Chicago Community Areas With the Most Two-to-Six-Flats
- Who Is Buying Chicago? The Buyer’s Name on 245,849 Deeds: Companies Bought 13 Percent of Homes and 46 Percent of Those Resold Within Two Years
- What a Chicago Home Actually Sold For: 245,849 Deeds Since 2018, All 77 Community Areas
- Where Chicago’s Gentrification Signals Are Active: East Garfield Park, New City and North Lawndale Show Four of Five. Logan Square, Avondale and the Lower West Side Show None.
- After the Wrecking Ball: A Rebuild Permit Follows at 84 Percent of Logan Square’s Demolished Sites, and at None of West Pullman’s 137
- Half of Cook County’s Houses and Small Apartment Buildings Date From 1954 or Earlier — and 2.2 Percent From 2010 or Later, by the Assessor’s Count
- Chicago Still Budgets 200 Building Inspectors. It Writes Half as Many Violations as in 2018.
- Chicago’s Two Renter Ordinances, Side by Side: Neither Text Before the Council Requires Just Cause. They Differ on Fees, Deposits and the Registry.
- South Shore After the Obama Center: What the Data Shows and What the Law Doesn’t
- Chicago Public Schools Counted 304,687 Students in Fall 2026, 11,537 Fewer Than in Fall 2025. Its 18,838 Kindergartners Were the Fewest in 22 Years of Files.