
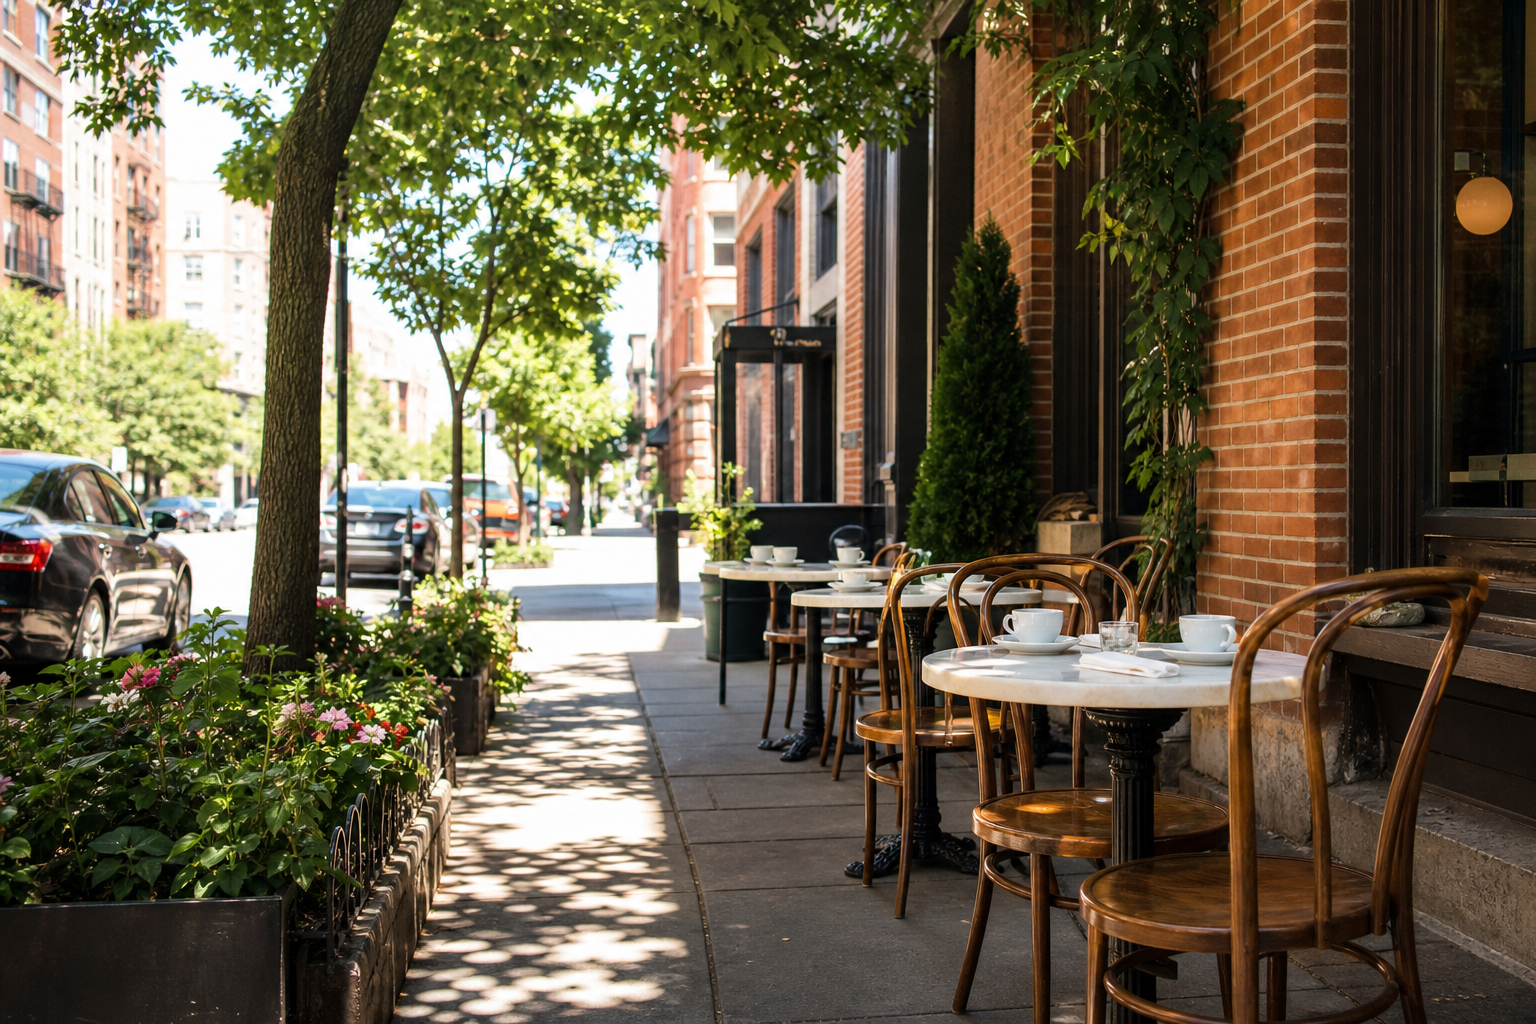

Count the permitted sidewalk cafés in Chicago’s own file — 1,192 in 2019, 1,169 in 2025 — and the city looks 98 percent recovered. Put the two seasons on a map and the recovery stops looking like a return: the Loop holds 108 permitted cafés where it held 144, while Lincoln Park, Lincoln Square, and Uptown all run more than a fifth above their 2019 counts. Chicago licenses outdoor restaurant seating on the public way one season at a time, and the permit file runs back to 2001. And the continuity is thinner than the totals: barely half of 2019’s cafés reappear on a 2025 permit under the same owner account at the same site.
Sidewalk Cafe Permits, Chicago data portal · retrieved August 8, 2026 · seasons 2019 and 2025 complete; 2026 in progressHow a season works in this file
A sidewalk café — outdoor restaurant seating on the sidewalk itself — needs a city permit, and the permit file describes the operating season as March 1 through December 1. The permits themselves follow that rhythm: every permit issued in a given calendar year expires at the end of the following February, so one permit covers one season, and this page counts a season’s cafés as the distinct owner-account-and-site combinations holding a permit issued that year. The paperwork habit has shifted, though: in 2019 the largest month for permit issuance was April, after the season opened; in 2025 and 2026 it is February, before. That shift is why this season already looks nearly complete — 1,093 cafés hold a 2026 permit issued by the end of July, against 1,144 permitted by the same date in 2019.
A quarter century, in five numbers
- 2001the file opens481
- 2017the peak season1,224
- 2019the last pre-2020 season1,192
- 2021the floor935
- 2025the latest complete season1,169
The file opens with 481 permitted cafés in 2001 and climbs almost every season to a peak of 1,224 in 2017. It records 1,063 permitted cafés in 2020 and 935 in 2021 — the lowest count since 2009 — and the climb back has 2025 within 23 cafés of 2019. Nothing in the permit file says why any of that happened — it records who held permission for sidewalk seating, season by season, and that is all this page counts.
The missing cafés are downtown
- Loop144 → 10875%
- Near South Side17 → 1376%
- Edgewater51 → 4282%
- Near North Side227 → 19686%
- West Town127 → 11087%
- Lincoln Square38 → 48126%
- Lincoln Park63 → 79125%
- Uptown31 → 38123%
- North Center46 → 52113%
- Logan Square59 → 64108%
The missing cafés are concentrated where the 2019 file was thickest. The Loop is at 75 percent of its 2019 count, the Near North Side at 86, West Town at 87, Edgewater at 82 — and those four areas plus the Near South Side account for more of the citywide gap than the gap itself, because a band of North Side areas moved the other way. Lincoln Park went from 63 permitted cafés to 79, Lincoln Square from 38 to 48, Uptown from 31 to 38, North Center from 46 to 52. In total, 29 community areas hold more permitted cafés than in 2019 and 19 hold fewer. The permit file records none of the reasons — it cannot see foot traffic, office occupancy, rents, or a restaurant’s books — so the pattern is stated here and left unexplained.
Barely half of 2019’s cafés return as the same account and site
Of the 1,192 account-and-site combinations permitted in 2019, 592 — just under half — hold a 2025 permit at the same site under the same account, and 526 hold one so far in 2026. The rest of the 2025 season, 577 cafés, runs under combinations absent from 2019. One caution cuts both ways: the file documents the account number as “the account number of the business owner, which will stay consistent across that owner’s licenses,” so a café that changed owners can break the link without closing for a day, and a combination that disappears from the file has not necessarily closed — it may have skipped a season or moved. The figure measures continuity of permit-holders, not survival of restaurants.
Fifteen areas have never had one
In 25 seasons the file records at least one sidewalk-café permit in 62 of Chicago’s 77 community areas. The other 15 — Archer Heights, Burnside, Calumet Heights, East Garfield Park, Fuller Park, Garfield Ridge, Greater Grand Crossing, Hegewisch, North Lawndale, O’Hare, Riverdale, Roseland, Washington Park, West Pullman, and Woodlawn — appear nowhere in it. That is a statement about this permit file, not about restaurants or dining: a sidewalk café requires both a restaurant and a permit application, and the file cannot say which is absent where. Chicago Lawn, for its part, went from zero permitted cafés in 2019 to four in 2025.
Known limits
Counts are permitted cafés, never restaurants, seats, or revenue. Three of the file’s 25,719 permit rows carry no location code and sit outside the area counts; they remain in citywide totals. The city’s separate current-permits file, counted the same way, resolves to 1,087 distinct cafés on the same retrieval date — within six of the 1,093 season-2026 cafés counted here; the two files are maintained separately, and this page uses the historical file throughout. The 2026 season is in progress, so its figures are season-to-date and compared only against the matched portion of 2019.
- Sources Sidewalk Cafe Permits, full history (nxj5-ix6z, rows updated July 31, 2026) and Sidewalk Cafe Permits — Current (qnjv-hj2q, validation only), retrieved August 8, 2026.
- Counting A season’s cafés = distinct (account number, site number) pairs among permits issued that calendar year. The pair is necessary: the site number is a per-account sequence, not a citywide site ID. Permit terms verified in the file: permits issued in year Y expire at the end of February of year Y+1. The 2019-vs-2026 comparison uses a matched window (permits issued January 1 through July 31 of each year) because issuance timing moved from an April peak in 2019 to a February peak now.
- Geography The portal’s computed community-area column stores internal region codes, not area numbers. The code-to-area crosswalk was derived from the city’s 311 file (v6vf-nfxy), which carries both columns: each of the 77 codes was assigned the community area that over 95 percent of that code’s 2026 311 rows name, with names from the city’s boundary dataset (igwz-8jzy). No permit record was excluded by the crosswalk; the three rows carrying no code are disclosed above.
Computed by KCM Desk from records retrieved August 8, 2026. Human-guided and edited — about this desk. If you spot an error, corrections come first.
Related Keep Chicagoland Moving coverage
- How Chicago Works, by the Numbers
- Chicago Deep Dish, by the Record: Born Fall 1943, With a Creator the Reference Work Never Names — and 2,445 Active Licenses With PIZZ in the Name
- The Chicago Community Areas With the Most Sidewalk Cafés
- We Followed 20,379 Failed Chicago Food Inspections to Each License’s Next Recorded Visit. 84.6 Percent Ended in Pass or Pass w/ Conditions.
- Chicago Had 1,386 Licensed Taverns in 2003. This July It Has 758.
- The L Stations With the Highest Ridership Recovery, Ranked (January–May 2026)