

This page includes links to products on Amazon. As an Amazon Associate I earn from qualifying purchases.
Chicago’s new air-sensor network has 391 days on the record — its first year and then some. Open Air Chicago — 277 non-regulatory sensors the Department of Public Health and UIC’s School of Public Health installed across the city in the summer of 2025 — posts a daily file, and that file now holds 102,907 sensor-days from July 26, 2025 through August 20, 2026. The median sensor-day read 9.02 micrograms of fine particulate (PM2.5) per cubic meter; nine in ten read below 18. And then there were July 16 and 17, 2026: with 283 sensors reporting, the network-wide daily mean reached 133.4 and then 167.8 — 281 and 279 sensors above 35.4 — two days inside a stretch the state EPA and the city had flagged for smoke from Canadian wildfires. July 2026 holds 1,057 of the file’s 1,093 sensor-days above 35.4, 97 percent of them. By the file’s own air-quality-index column, 50.5 percent of sensor-days were Good and 48.4 percent Moderate; 1.1 percent were worse. These are the program’s provider-calibrated daily means from sensors the program itself calls non-regulatory, and nothing here is a compliance finding.
Open Air Chicago Day Aggregations, Chicago data portal · updated daily · 102,907 sensor-day rows retrieved August 21, 2026 · program pages + state EPA releases read the same dayWhat the network is, by the program’s own pages
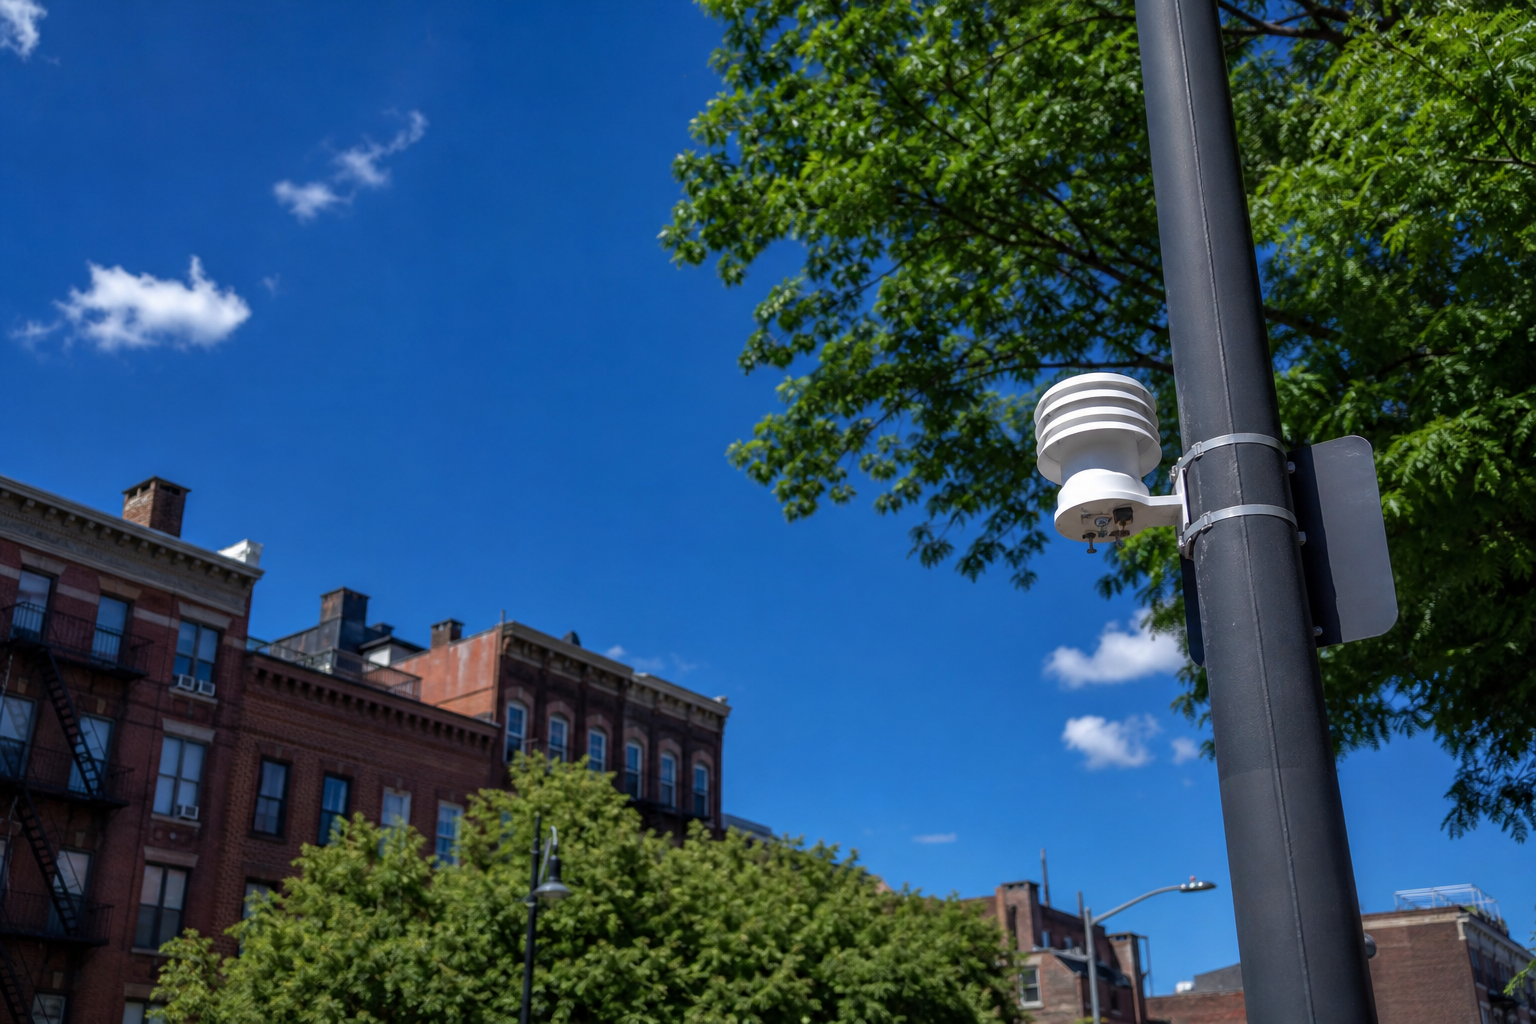
The city’s Open Air Chicago page describes 277 sensors “collecting data on fine particulate matter (PM2.5) and nitrogen dioxide (NO2),” installed over six weeks in summer 2025 on a grid with spacing under a mile — 0.87 miles in communities with higher scores on the city’s environmental-justice index, 0.93 elsewhere — to supplement the federal-grade monitors on AirNow.gov. The daily file’s own description adds the terms this page lives by: each row is one sensor’s 24-hour mean over a UTC day; PM2.5 and NO2 come both raw from the sensor and “cloud-calibrated” by the provider with a global correction factor, in columns ending .raw and .value; only rows that passed the provider’s automated quality checks are published; the black-carbon modules were offline at launch; and the network’s sensors are “non-regulatory.” The file carries 286 sensor names — the 277 network sensors plus nine labeled “Collocation,” sited at federal monitoring stations (Mayfair, Schiller Park, Washington High School), which the description says exist to inform a possible local correction factor. Sensor names are community area plus a number, and every one of the 77 community areas carries at least one; South Deering has ten, Austin nine, Ashburn eight.
Thirteen months of sensor-days
- Median sensor-day9.02µg/m³
- Mean11.11µg/m³
- 90th percentile17.97µg/m³
- 99th percentile36.48µg/m³
- Highest single sensor-day(West Ridge 4, July 16, 2026)279.2µg/m³
The provider-calibrated PM2.5 value is present on 101,873 of the 102,907 sensor-days. Half of them read 9.02 µg/m³ or less, nine in ten 17.97 or less, and 99 in 100 under 36.5; the mean, pulled up by the July days, is 11.11. Two reference points, labeled as what they are: the EPA’s primary, health-based standards for PM2.5 are 9.0 µg/m³ as an annual mean averaged over three years and 35 µg/m³ as a 24-hour 98th percentile averaged over three years (a separate secondary annual standard also exists), both measured at regulatory monitors; these sensors are not regulatory monitors and a single day is not a three-year statistic, so the comparison is a yardstick, not a finding. Against the annual value, 51,071 sensor-days (50.1 percent) read above 9.0. The threshold used for single days throughout this page is 35.4 µg/m³ — the top of the AQI “Moderate” range, the breakpoint the file’s own index column turns on, rather than the 35 of the standard — and 1,093 sensor-days (1.1 percent) read above it, 562 above 55.4 and 325 above 150.4, the next two breakpoints. The file also carries the provider’s own US EPA air-quality-index figure for each sensor-day, and binning that column by the EPA’s published categories gives 51,474 Good days (50.5 percent), 49,310 Moderate (48.4 percent), 527 Unhealthy for Sensitive Groups, 115 Unhealthy, 445 Very Unhealthy and 2 Hazardous — the 1,089 sensor-days above Moderate are 1.1 percent. Nitrogen dioxide ran between 12.2 and 19.0 parts per billion as a monthly mean across the network, highest in February 2026; the single sensors with at least 200 days range from 10.3 ppb (Hegewisch 4) to 25.3 (New City 3). The raw sensor figure for PM2.5 runs higher than the calibrated one by a median 4.56 µg/m³; this page uses the calibrated value the program designates.
The days that spiked
- July 17, 2026(283 sensors; 279 above 35.4; max 231.3 at Lincoln Square 1)167.8µg/m³
- July 16, 2026(283 sensors; 281 above 35.4; max 279.2 at West Ridge 4)133.4µg/m³
- July 19, 2026(282 sensors; 264 above 35.4)43.2µg/m³
- July 20, 2026(282 sensors; 167 above 35.4)35.5µg/m³
- July 5, 2026(283 sensors; 66 above 35.4)28.3µg/m³
- February 15, 2026(281 sensors; none above 35.4)26.3µg/m³
- January 6, 202626.2µg/m³
- December 2, 202526.1µg/m³
The network’s daily mean — the average of every reporting sensor’s 24-hour mean — sat at 12.5 on July 15, 2026, rose to 133.4 on July 16 and 167.8 on July 17, fell to 13.0 on July 18, and rose again to 43.2 on July 19 and 35.5 on July 20 before 16.8 on July 21. On July 16, 281 of 283 sensors read above 35.4; on July 17, 279. The file records no cause. The agencies did: the city’s Office of Emergency Management — in a July 15 notice — reported that the National Weather Service and the Illinois EPA had issued an Air Quality Alert for Chicago and Cook County through Thursday, July 16 “due to smoke from Canadian wildfires” and that a Red Forecast Air Pollution Action Day had been declared for July 16; the Illinois EPA’s July 14 release had flagged “the potential for wildfire smoke reaching parts of northern Illinois by Thursday, July 16th,” and its July 18 release called an areawide Action Day for Sunday, July 19 “in addition to the ongoing Chicago Air Pollution Action Day in effect today July 18th,” with smoke expected to return Saturday afternoon. The sensor file is consistent with those declarations on the dates they cover — July 16, and July 18 and 19 — and July 17, the highest day, sits between them; the attribution is the agencies’, and the file records none. Without the July stretch the file’s peaks are ordinary winter days in the mid-20s — February 15, January 6, December 2 — and the lowest network-wide day was October 22, 2025, at 3.54. By month, the network’s mean PM2.5 ran from 7.44 in October 2025 and 7.51 in June 2026 to 13.76 in December, 13.93 in February, and 23.62 in July 2026.
Where sensors read highest and lowest
- Avalon Park 1(368 days)18.38µg/m³
- Portage Park 5(384 days)14.53µg/m³
- Austin 413.86µg/m³
- Portage Park 313.61µg/m³
- North Lawndale 513.11µg/m³
- Riverdale 3(377 days)4.74µg/m³
- Uptown 47.57µg/m³
- Gage Park 17.87µg/m³
- South Deering 28.42µg/m³
- Morgan Park 38.59µg/m³
- Avalon Park(3 sensors)13.63µg/m³
- North Lawndale(5 sensors)12.28µg/m³
- New City(5 sensors)12.20µg/m³
- Portage Park(5 sensors)12.19µg/m³
- South Lawndale(6 sensors)11.95µg/m³
- Riverdale(3 sensors)9.42µg/m³
- Near South Side(2 sensors)9.95µg/m³
- O’Hare(3 sensors)9.99µg/m³
- Lincoln Park(2 sensors)10.01µg/m³
- Hyde Park(4 sensors)10.02µg/m³
A sensor’s mean here is the mean of its own available sensor-days — from 58 days at the shortest-lived sensor to 391 at the longest, with 271 of the 286 carrying 300 or more. Avalon Park 1 reads highest among sensors with at least 200 days, at 18.38, and Riverdale 3 lowest at 4.74; the spread between the highest and lowest community-area means with two or more sensors is narrower, from Avalon Park’s 13.63 across three sensors to Riverdale’s 9.42 across three. Why one sensor reads high or low is not in the file — siting, local sources, and the sensor itself all sit outside it — and this page does not guess. One check on the names: we placed each sensor’s coordinates against the city’s community-area boundaries, and 273 of the 282 with coordinates fall in the area their name carries; of the nine that do not, six are the Collocation sensors named for federal sites (the Mayfair sensors sit in Portage Park, the Washington High School sensors in East Side) and three sit just across a boundary (Hyde Park 3 in Woodlawn, Burnside 1 in Chatham, Pullman 2 in South Deering). The names are the program’s labels and are used as such; the Collocation sensors are left out of the area tables.
Known limits
The sensors are non-regulatory by the program’s own description, and the figures are provider-calibrated daily means that passed its automated quality checks; what was invalidated is not in this file. Days are UTC days, which end at 7 p.m. Chicago time in daylight-saving months and 6 p.m. in standard time, so a Chicago evening spills into the next row. Means are means of the sensor-days available, which differ by sensor. The EPA standards quoted are three-year statistics at regulatory monitors and are reference points here, not determinations. The July attribution to wildfire smoke is the state EPA’s and the city’s; the file records readings, not causes. This page makes no health claim about any reading and takes no position on where anyone should live.
- Source Open Air Chicago Day Aggregations (rtmx-vkjr, Chicago data portal, data owner CDPH and UIC SPH), 102,907 rows retrieved August 21, 2026, covering July 26, 2025 through August 20, 2026; the dataset updates daily.
- Counting One row is one sensor’s UTC day; the sensor-day key (sensor ID + day) is unique across the file. PM2.5 figures use the provider-calibrated value column (pm2_5concmass24hourmean_value) and NO2 the corresponding value column; AQI categories bin the file’s own AQI value column by the EPA’s published breakpoints. Network-wide daily means average all sensors reporting that day (tables restrict to days with 100 or more); sensor and area means average the sensor-days available. Percentages are computed from raw counts.
- Geography Sensor names carry a community area, per the data dictionary. Each sensor’s coordinates were placed against the city’s community-area boundary polygons (igwz-8jzy) by point-in-polygon; 273 of 282 with coordinates agree with their name, and the names are used as the program’s labels. Area tables exclude the nine Collocation sensors.
- Documents the city’s Open Air Chicago page; the city’s July 15, 2026 Air Pollution Action Day notice; the Illinois EPA’s July 14 and July 18, 2026 releases; and the EPA’s NAAQS table, all retrieved August 21, 2026.
ON AMAZON
For indoor air
- Amazon Smart Air Quality Monitor. A monitor for temperature, humidity, carbon monoxide, PM2.5 and VOCs.
- GoveeLife Smart Air Quality Monitor with PM2.5 H5106. A wired PM2.5 monitor with an LED display.
- Levoit Air Purifier for Home. A home air purifier.
As an Amazon Associate I earn from qualifying purchases.
Computed by KCM Desk from records retrieved August 21, 2026. Human-guided and edited — about this desk. If you spot an error, corrections come first.
Related Keep Chicagoland Moving coverage
- Chicago Reads Its Sewers Weekly: Four Viruses, Seven Sites, 237 Weeks — and Every Virus Sat at Minimal in the Newest Week on the File
- Chicago Measures Its Own Air Now: 286 Sensors, 2,544,089 Hourly Readings — and 96 Percent of Its 100-Plus PM2.5 Hours Landed on Two July Dates
- How Chicago Works, by the Numbers
- West Nile Season Is Surging in Chicago’s Trap Ledger: 187 Positive Pools So Far, the Fourth-Most at This Point in Twenty Seasons
- The Yellow Flag Flies 7 Times as Often at One Chicago Beach as at Another