

This page includes links to products on Amazon. As an Amazon Associate I earn from qualifying purchases.
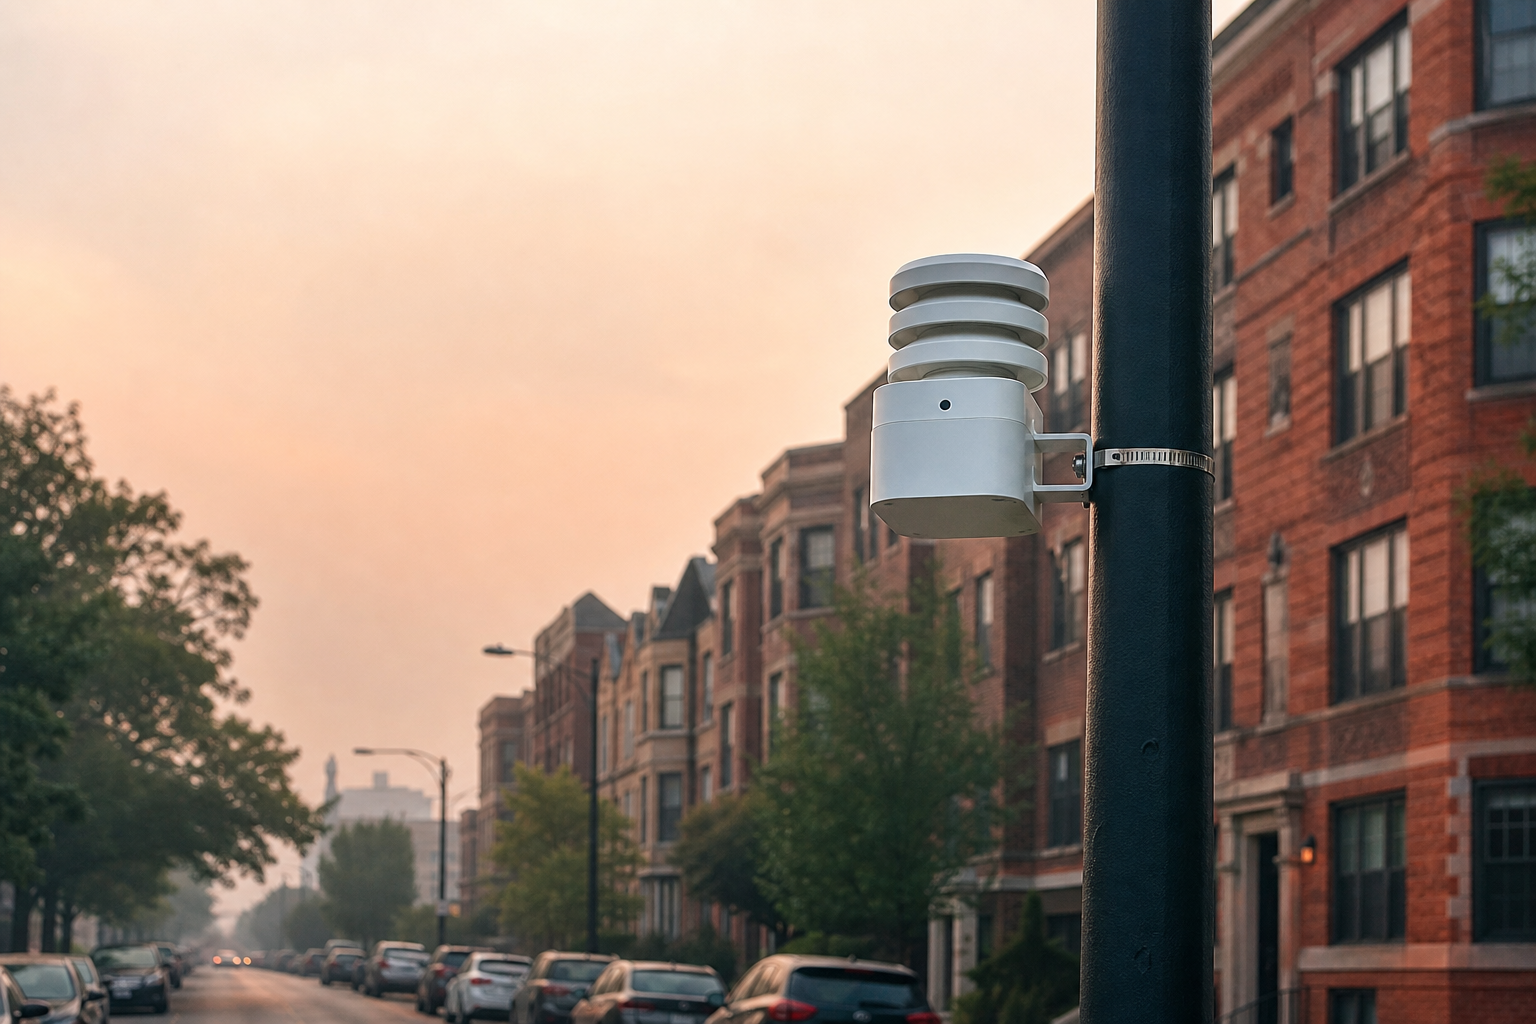
Chicago now measures its own air, sensor by sensor, hour by hour. The portal describes the program in one line: “Sensors deployed throughout the City by Open Air Chicago measuring fine particulate matter 2.5 (PM2.5) and nitrogen dioxide (NO2).” The hourly file holds 2,544,089 rows — one per sensor per hour since July 26, 2025 — from 286 sensors whose names carry, per the field’s own definition, a community area name and a number: all 77 community-area names appear, plus three collocation sites. The record’s PM2.5 extremes cluster on two UTC dates, July 16 and 17, 2026 — a South Deering sensor logged an hour at 486.8 micrograms of fine particulate per cubic meter, and 96 percent of every sensor-hour the network has ever recorded at or above 100 μg/m³ landed on those two dates.
Open Air Chicago — Hour Aggregations (di9s-96ws), 2,544,089 sensor-hour rows, July 26, 2025 through August 31, 2026 (UTC), retrieved September 2, 2026, beside the 13,836,810-row individual-measurements file · the portal’s own caution, quoted whole: “The data are sensor-based and not for regulatory purposes” · readings here use the cloud-calibrated value columns; PM2.5 in μg/m³ and NO₂ in ppb, per the columns’ own definitionsA network that covers the whole map
The sensor roster reads like a gazetteer: 286 sensors whose names span every one of the 77 community-area names, from Albany Park 1 to Woodlawn 2, plus three sites whose names end in “Collocation” — Mayfair, Schiller Park, and Washington HS, printed as filed. The thickest clusters: South Deering with 10 sensors, Austin with 9, Ashburn with 8, the Near West Side with 7. Why the map weights where it does, the file doesn’t say. The rollout was fast: 17 sensors show their first hourly rows in July 2025, another 254 in August 2025, and the stragglers through December — first-row dates, we note, not installation records.
Two UTC dates hold the PM2.5 record book
Every reading in this section is a cloud-calibrated hourly value, timestamped in UTC as the file keeps it. The highest PM2.5 hour in the record belongs to the sensor South Deering 2: 486.8 μg/m³ for the hour starting 21:00 UTC on July 16, 2026, with the same sensor’s 485.8 the hour before. The highest value in the file’s NowCast-AQI column belongs to Norwood Park 2: 737, for the hour starting 01:00 UTC on July 17, 2026. Across the record’s 2,515,162 sensor-hours carrying a PM2.5 value, 8,391 have ever reached 100 μg/m³ — and 8,021 of them, 96 percent, fall on just two UTC dates: July 17 (4,189 sensor-hours) and July 16 (3,832). What put those numbers there is not in the file, and this page attributes nothing; the dates and the readings stand as recorded.
| UTC date | Sensor-hours at or above 50 μg/m³ |
|---|---|
| 2026-07-17 | 4,653 |
| 2026-07-16 | 4,191 |
| 2026-07-19 | 1,280 |
| 2026-07-05 | 527 |
| 2025-07-31 | 157 |
The table’s shape says it plainly: after the two July peaks come July 19 (1,280 sensor-hours), July 5 (527), and — the only 2025 entry in the top five — July 31, 2025, at 157. Every date in the top five is a July date, four from 2026 and one from 2025. That observation is ours; the file offers dates, not seasons.
The ordinary air, which is the point
Zoom out from those 48 hours and the counts thin fast: hours at or above 50 μg/m³ number 11,403 — 0.45 percent of the 2,515,162 sensor-hours carrying a PM2.5 value — and the 50-and-100 thresholds here are our own round-number bands, not anyone’s official categories. A network like this earns its keep on the unremarkable hours: they are the baseline that makes the loud hours measurable, sensor by sensor.
The second pollutant keeps different hours
Nitrogen dioxide’s peaks live nowhere near July: the highest NO₂ hourly value in the file is 61.7 ppb at Near West Side 4, for the hour starting 13:00 UTC on January 24, 2026, and the same sensor holds second place from a May afternoon. Two pollutants, two calendars, one network — the file offers the contrast and, as ever, no explanation, so neither do we.
How to read a sensor file honestly
Four of the file’s own footnotes travel with every number on this page. First: “The data are sensor-based and not for regulatory purposes” — these are Clarity Node-S sensors, not the regulatory monitors that official air-quality determinations rest on. Second, calibration: for PM2.5 and NO₂, “value is cloud-calibrated and different from raw,” and this page uses the calibrated value columns throughout. Third, clocks: the hour column is, in the file’s words, in “UTC (not Chicago time),” so every date above is a UTC date — Chicago’s own evening of July 16 spills into July 17 UTC. Fourth, the gap: “the black carbon modules are currently offline,” so the black-carbon columns sit empty, by the file’s own notice.
- Sources: Open Air Chicago’s Hour Aggregations file (di9s-96ws; 2,544,089 rows, one per sensor per UTC hour) and Individual Measurements file (xfya-dxtq; 13,836,810 rows), both retrieved September 2, 2026, covering July 26, 2025 through August 31, 2026. All figures are server-side aggregates; quoted lines are the portal’s own descriptions.
- Columns: PM2.5 figures use pm2_5concmass1hourmean_value (μg/m³, per the column definition), AQI figures the file’s PM2.5 NowCast US-EPA-AQI value column, NO₂ figures no2conc1hourmean_value (ppb); null values are excluded and the with-value denominator (2,515,162) is stated.
- Sensor names: the sensor_name field is defined by the portal as community area name plus sensor number; 80 distinct name prefixes resolve to the 77 community-area names plus 3 collocation sites, and names are printed as filed.
- Not here: no cause is attributed to any reading, high or low; no health claim or threshold category is applied (50 and 100 μg/m³ are our round-number bands); regulatory air-quality determinations belong to the regulatory monitors, per the file’s own caution.
ON AMAZON
For indoor air
- Amazon Smart Air Quality Monitor. A monitor for temperature, humidity, carbon monoxide, PM2.5 and VOCs.
- GoveeLife Smart Air Quality Monitor with PM2.5 H5106. A wired PM2.5 monitor with an LED display.
- Levoit Air Purifier for Home. A home air purifier.
As an Amazon Associate I earn from qualifying purchases.
Computed by KCM Desk from Open Air Chicago’s published sensor files, retrieved September 2, 2026. Human-guided and edited — about this desk. If you spot an error, corrections come first.
Related Keep Chicagoland Moving coverage
- Is Lake Michigan Warmer Than the Air? Chicago’s Paired Beach Sensors Recorded the Water Warmer on About One Matched Hour in Three
- How Chicago Works, by the Numbers
- The Yellow Flag Flies 7 Times as Often at One Chicago Beach as at Another
- In Chicago’s Big-Building Energy File, 769 Buildings Wear Four Stars and 564 Wear Zero — and 542 Didn’t File for 2023
- Chicago’s New Air-Sensor Network, Its First 391 Days: 102,907 Sensor-Days, a Median Day Near 9 Micrograms — and Two July 2026 Days When the Network-Wide PM2.5 Mean Hit 133 and 168
- Did You Know? Chicago, by Its Own Records