
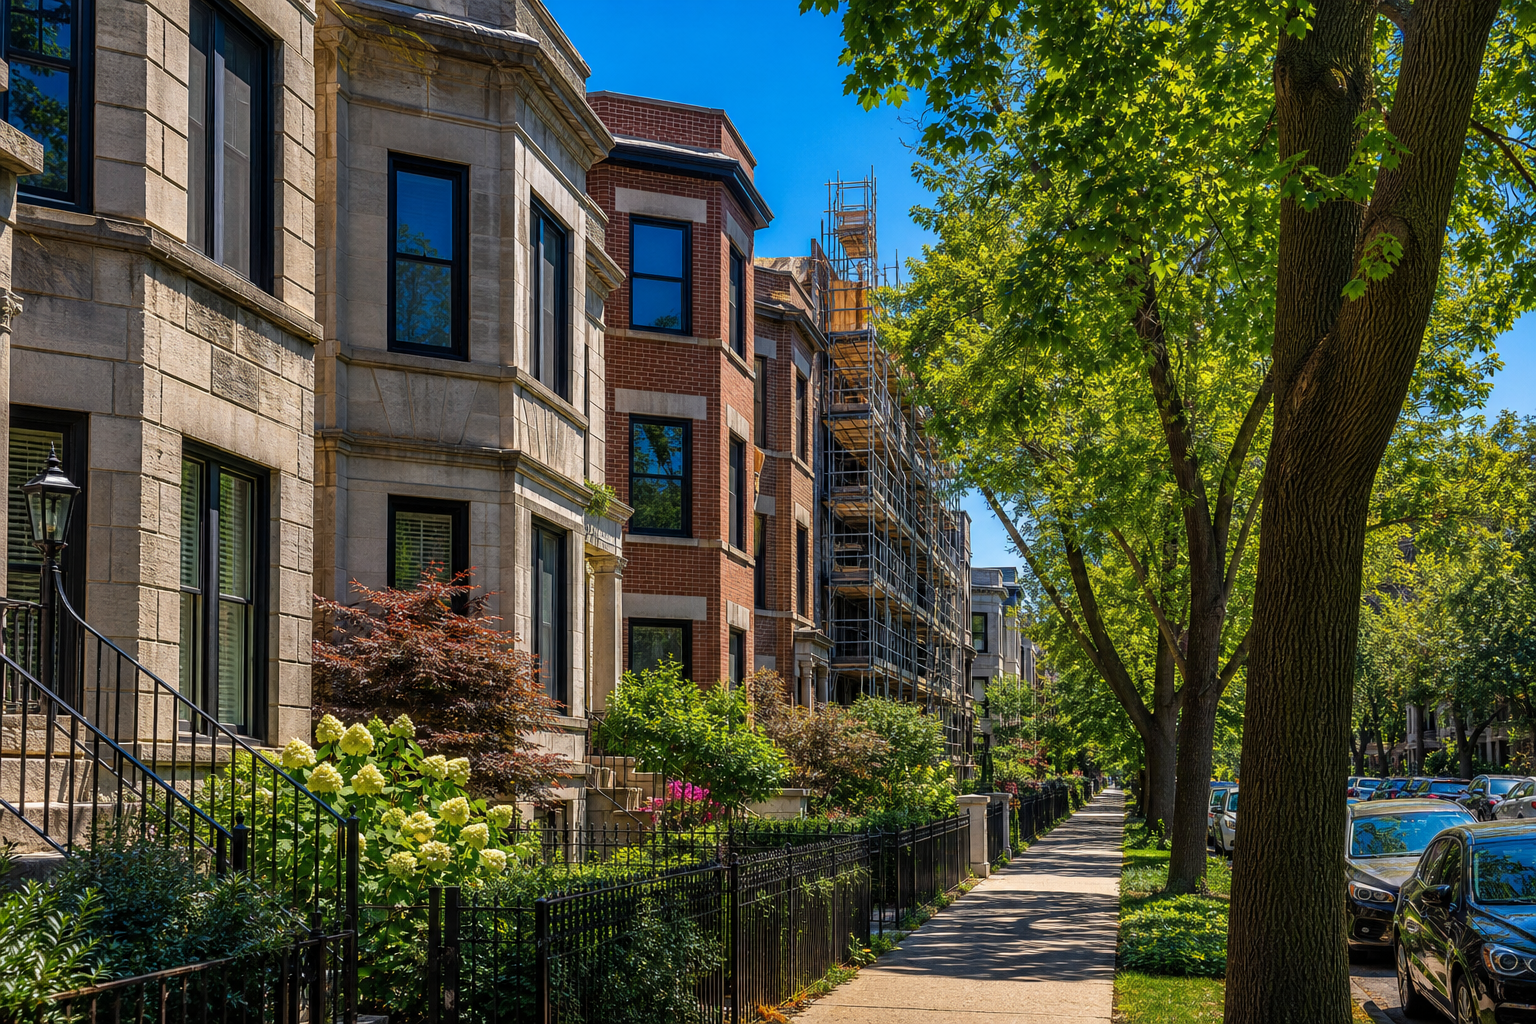

For January through April 2026, Chicago’s median recorded sale prices for houses, condos and two- to six-flats stand 20, 18 and 29 percent above the same months of 2023, the lowest of the five years measured here, and the city issued 439 new-construction permits in those months, the most in five years. A third figure this page printed in July, a 22 percent rise in the number of sales, was wrong: on the county file as it stands now, the same comparison reads 6 percent down.
Cook County recorded sales and City of Chicago permits · January through April · read July 19, 2026 and September 30, 2026Correction, September 30, 2026: when this page was published on July 19, 2026, it said Chicago’s recorded sales for January through April rose from 5,492 in 2025 to 6,690 in 2026, and its opening said the city’s records “rose” through April. The 2025 count was not complete. By its September 15, 2026 update the county’s file held 7,406 sales for January through April 2025 and 6,938 for the same months of 2026, which is 6 percent fewer where we had printed 22 percent more. The page also said the Chicago figures carry no margin of error. They carry no sampling error; the sales count turned out to carry a larger error of another kind, and the section on it has been rewritten. Computed the same way on both dates, median prices moved by no more than 2.3 percent between the two readings, and the January-through-April permit counts did not move at all. The current Chicago figures below come from the files as retrieved September 30, 2026; the July readings are shown beside them wherever the two differ.
A second correction, same date: the condo medians on this page used to include parcels that are not homes. Parking spaces, storage units and building common areas are recorded and sold as condominium parcels, and the Assessor flags them in a separate file: 74 to 134 of the condo sales in each of these four-month windows. The current condo medians leave them out, which raises each one by between $5,000 and $9,900 and lowers the condo gain since 2023 from 19 percent to 18 percent. House and two- to six-flat figures are not affected.
The national figures, and the margins printed beside them
These were the two national figures in the news when this page was first published. On May 28, 2026, the Census Bureau and the Department of Housing and Urban Development reported that sales of new single-family houses ran in April at a seasonally adjusted annual rate of 622,000, meaning the month’s pace, adjusted for the season and multiplied out to a full year. They put that at 6.2 percent below March and 11.3 percent below April of the previous year. Separately, in July, the Housing Market Index, a survey in which homebuilders are asked to rate conditions in their own market, read 34, two points below its June reading. Both are given here as published on those dates; Census revises its estimates in later releases, and we have not updated them.
Both figures are national, and the first counts only newly built single-family houses. The Chicago figures on this page cover houses, condominiums and two- to six-flats, the small apartment buildings of two to six units, of every age. Those are different universes, and nothing here treats one as a check on the other.
Both of those percentages carry an asterisk in the release itself. The decline from March is 6.2 percent give or take 12.8. The decline against the previous April is 11.3 percent give or take 11.5. Each margin is wider than the figure it qualifies. Census sets out what that means further down the same document: where the range includes zero, the change is not statistically significant, and it is uncertain whether there was an increase or a decrease. New-home sales are estimated from a sample, and for April the sample could not establish the direction of either change.
Chicago’s records are built another way. Each figure starts from the records themselves: every recorded sale that passes the filters set out at the end of this page, every permit of one type. The counts are counts of those records and the medians are computed from the same sales. Nobody is sampled, so there is no sampling margin to print. In July this page stopped there, and that was the mistake. A count has its own kind of error: whether everything that happened has been written down yet. Nothing in the file states the size of that error. Reading the file twice, as we did for this page, shows how much it changed between the two dates. It does not show how much is still missing.
Prices: above the same months of 2023 in all three types of home
Across the five years here, the January-through-April median for each of the three types was lowest in 2023 and has been higher in every year since. A median is the middle sale: half sold for more, half for less. The chart shows each type’s January-through-April 2023 median, the low of the five, and where it stands in 2026.
| Median sale price | 2022 | 2023 | 2024 | 2025 | 2026 |
|---|---|---|---|---|---|
| Houses | $300k | $269k | $298k | $310k | $323k |
| Condos | $308k | $300k | $320k | $335k | $355k |
| Two- to six-flats | $379k | $358k | $395k | $412k | $460k |
Houses are up 20 percent on the same months of 2023, condos 18 percent, and two- to six-flat buildings 29 percent. Of the three, the small apartment buildings moved the furthest. The county file records the building, not who lives in it, so nothing here says whether those units are rented or owner-occupied.
How much did the medians move when the county added sales? Very little. Computed as the July page computed them, with the parking and storage parcels still in the condo rows, the nine medians for 2022 through 2024 came back identical. Of the six for 2025 and 2026, two were identical and the largest change was 2.3 percent: two- to six-flats in 2025, from $402,250 to $411,500. The medians changed little even though the counts behind them changed a great deal.
| Median, January–April | 2025 on July 19 | 2025 on Sept. 30 | 2026 on July 19 | 2026 on Sept. 30 |
|---|---|---|---|---|
| Houses | $310,000 | $310,000 | $324,900 | $322,500 |
| Condos | $325,000 | $325,000 | $345,000 | $349,000 |
| Two- to six-flats | $402,250 | $411,500 | $460,500 | $460,000 |
Permits: 439 in four months, the most in five years
| Year | 2022 | 2023 | 2024 | 2025 | 2026 |
|---|---|---|---|---|---|
| New-construction permits | 414 | 332 | 295 | 374 | 439 |
The city issued 439 new-construction permits in the first four months of this year, the most of the five years and 49 percent above 2024, the lowest. One permit can cover a garage or a tower, so the count measures permits issued, not homes built. Builder sentiment is a national survey of how builders rate their market and a permit count is a local record of what the city issued, so the two are different instruments.
Did the permit file move between our readings the way the sales file did? It did not. All five January-through-April counts came back the same on September 30, 2026 as on July 19, 2026, and so did every month from January through June of 2025 and 2026. Only July 2026 changed, from 91 to 186, because in July we read the file on the 19th of the month.
The sales count: what we printed in July and what the file holds now
| Recorded sales, January–April | 2022 | 2023 | 2024 | 2025 | 2026 |
|---|---|---|---|---|---|
| As read July 19, 2026 | 11,438 | 7,551 | 7,562 | 5,492 | 6,690 |
| As read September 30, 2026 | 11,438 | 7,551 | 7,562 | 7,406 | 6,938 |
On July 19, 2026 the file showed 5,492 sales for January through April 2025 and 6,690 for the same months of 2026, and we printed the difference as a 22 percent rise. By September 30, 2026 the county had added 1,914 sales to those four months of 2025, 35 percent more than we had counted, and 248 to the four months of 2026. The comparison now reads 7,406 against 6,938: 6 percent fewer. The counts for 2022, 2023 and 2024 did not change by a single sale.
These are counts of sale records, and both readings include the parking and storage parcels, 74 to 134 of them in each year’s four months, because the July reading could not separate them. Without them the current comparison is 7,321 homes against 6,864, the same 6 percent.
| Month of sale | 2025 on July 19 | 2025 on Sept. 30 | 2026 on July 19 | 2026 on Sept. 30 |
|---|---|---|---|---|
| January | 1,016 | 1,427 | 1,258 | 1,267 |
| February | 1,246 | 1,590 | 1,426 | 1,442 |
| March | 1,041 | 1,995 | 1,971 | 2,016 |
| April | 2,189 | 2,394 | 2,035 | 2,213 |
| May | 2,389 | 2,595 | 969 | 1,838 |
| June | 1,672 | 2,546 | 0 | 894 |
| July | 2,020 | 2,439 | 0 | 196 |
The monthly table shows where the additions landed. March 2025 went from 1,041 to 1,995. In July we looked at the 2026 months, saw May half-empty and June and July blank, and cut every year back to April, the last month that did not look cut short. That avoided one artifact. Set against January through June of 2022, the first six months of 2026 on the July file showed a 59 percent collapse, 7,659 sales against 18,686, and part of that gap was nothing more than missing months: on January through April alone, 2026 stood 42 percent below 2022 in July and stands 39 percent below it now. What we did not test was the 2025 months, which looked full and were not.
Is 6 percent down the answer, then? No. On July 19, when we first read the file, the sales dated January through April 2025 were already 15 to 18 months old, and the file still lacked 1,914 of the 7,406 it now holds for those months, about a quarter. The same months of 2026 are only 5 to 8 months old as of September 30. Our inference, from the 248 sales the county already added to those months between our readings, is that the 2026 count will keep rising. That is an inference from one interval. We cannot say by how much, and we do not know whether the 2025 sales arrived as a steady trickle or in one batch. So this page draws no conclusion about whether more or fewer homes are changing hands than last year. What the record does support is the longer comparison: 7,551 sales in those four months of 2023 and 7,562 in 2024, each about a third below the 11,438 of 2022, on counts that did not change between our readings.
Set that beside the Census margin. The national new-home figure moved 6.2 percent and came with a printed margin of 12.8 points. Our own comparison moved 28 percentage points between two readings, from 22 percent up to 6 percent down, and no margin was printed anywhere. The estimate carried its sampling uncertainty beside the number. The count came with no warning, and neither did our page. We traced the same additions for houses alone in our corrected count of January-through-April house sales.
What this does and does not establish
- On the recordChicago median recorded sale prices for January through April are above the same months of 2023, the lowest of the five years here, in all three property types: houses +20%, condos +18%, two- to six-flats +29%.
- On the recordNew-construction permits for January through April are at 439, the highest of the last five years, on a file that returned the same five counts on both readings.
- On the recordThe mix between the three types barely moved: houses ran 39 to 41 percent of sales in all five years, so a shift between the three types does not explain the rise in medians. Shifts inside a type are not ruled out.
- On the recordJanuary-through-April sales in 2023 and 2024 were about a third below 2022: 7,551 and 7,562 against 11,438. Those three counts were identical on both readings.
- Not establishedWhether sales in 2026 are running above or below 2025. The file read 22 percent up in July and reads 6 percent down now, and both years are still receiving sales.
- Not establishedThat Chicago contradicts the national figures. They are different measures. One national number is a sample survey of sales of newly built homes; the other is a survey of how builders rate their own market. The Chicago figures are recorded sale prices of homes of every age, new and existing alike, because the county file carries no flag that reliably separates the two.
- On the recordCensus flags both of its April percentage changes as not statistically significant. That is the agency’s own determination, printed beside the figures.
- Not establishedThat the national market is fine. A decline the survey could not measure may still have happened; that release cannot settle it.
- Not establishedWhy Chicago’s numbers moved the way they did. Deeds and permits record what happened. Nothing here identifies a cause.
- Not establishedWhat happens next. If this autumn’s sales arrive the way the 2025 sales did, the file will not show them in full for many months.
How we counted
- Two readings. Every Chicago figure on this page was computed twice with the same queries: on July 19, 2026 and on September 30, 2026, when the county’s sales file had last been updated on September 15, 2026 and its newest sale was dated July 14, 2026. Where the two readings differ, the page shows both. The July figures are kept in our repository as they were published.
- Where the sales are from: the eight Cook County townships that the county assesses as the City of Chicago, township codes 70 through 77. Any city land assessed in a suburban township is not included, and no suburban sale is in any figure here. The permit file covers the whole city.
- No sampling error is not the same as no error. The Chicago numbers are counts of records that met the filters set out here: recorded sales in the three property classes that pass the county’s market-sale screens, and permits of the single type PERMIT – NEW CONSTRUCTION. Every other permit type the city issues is outside this article. A count like that has no sampling margin. It can still be incomplete, and for the two most recent years the sales count was and may still be.
- Sales: Cook County’s recorded sales file, dataset wvhk-k5uv, filtered with the county’s own market-sale flags: no sub-$10,000 transfers, no excluded deed types, no repeat sale inside 365 days, no multi-parcel sales. The county calls what remains arms-length sales. The flags screen out likely non-market transfers; they do not verify each sale that remains. Two screens are ours: we drop sales under $20,000 and over $5,000,000, prices at which we judge a record more likely to be a nominal transfer or a data-entry error than an ordinary home sale. Every year is filtered identically.
- The window. January through April for every year. In July, April was the last month of 2026 whose count did not look cut short. That was an inference from the shape of the 2026 counts, and it said nothing about 2025, whose months were still being added to. Between our two readings the recent-year counts only grew, so we treat them as incomplete.
- Parking and storage: a condominium parcel can be a parking space, a storage unit or a common area. The Assessor flags those in its condominium file, and says identifying them is an ongoing cleanup. The current condo medians leave out every sale of a parcel flagged that way in any tax year since 2018. The July reading could not make that separation, so the side-by-side counts and the table of medians on the two readings keep those parcels in on both sides.
- Property types are kept apart. Assessor classes 202-210, 234, 278 and 295 are houses; 299 is a condominium; 211 is a two- to six-flat. Combining them lets a shift in the mix move the median with no price change anywhere, so each is reported on its own.
- Permits: City of Chicago building permits, dataset ydr8-5enu, permit type PERMIT – NEW CONSTRUCTION, current through September 28, 2026 on the second reading. We ran a month-by-month test on this file on both dates. January through June returned 68, 82, 132, 157, 130 and 129 for 2026 against 75, 80, 95, 124, 131 and 161 for 2025, the same on both readings. July 2026 read 91 on July 19, when the latest permit in the file had been issued on July 17, and reads 186 now. That is one comparison across ten weeks; it does not make the permit file final.
- National figures, with their dates and their publishers: April 2026 new-home sales are a joint series from the U.S. Census Bureau and the U.S. Department of Housing and Urban Development. We read the agencies’ own release, CB26-85, issued May 28, 2026, and both percentage changes we quote carry Census’s asterisk for not statistically significant. Builder confidence is a different kind of number: the NAHB and Wells Fargo Housing Market Index, a survey in which homebuilders rate their own market. It read 34 for July 2026, two points below an upwardly revised June reading of 36, in NAHB’s release of July 16, 2026. We have not recomputed or updated either figure, and both are national.
- Medians, not averages, because a handful of very large sales pull an average upward, while the median stays at the middle sale by price.
- Run it yourself. Both datasets answer Socrata queries. Sales: township_code in (‘70’…‘77’) and sale_filter_less_than_10k=false and sale_filter_deed_type=false and sale_filter_same_sale_within_365=false and is_multisale=false and num_parcels_sale=1, with sale_date inside January 1 to May 1 of each year, sale_price above 20,000 and below 5,000,000, and the class list for each property type given above. Permits: permit_type = ‘PERMIT – NEW CONSTRUCTION’ with issue_date inside the same January-to-May window. The monthly counts use the identical filters, one month at a time, which is why January through April add up to each year’s four-month total. A later run may return different counts for 2025 and 2026; between our two readings they rose.
Computed by KCM Desk from Cook County recorded sales and City of Chicago permit records as retrieved September 30, 2026; first published July 19, 2026, corrected September 30, 2026. Human-guided and edited — about this desk. If you spot an error, corrections come first.
Related Keep Chicagoland Moving coverage
- Chicago Housing, by the Numbers
- Chicago’s January–April House Sales Now Read 5.6 Percent Below Last Year, Not 23 Percent Above — the County Added 1,147 Sales to 2025 After Our July Count
- What a Chicago Home Actually Sold For: 245,849 Deeds Since 2018, All 77 Community Areas
- Chicago Took $3.85 Billion Off Its Assessment Roll on Appeal. Among Ordinary Parcels, Commercial Property Got 86 Cents of Every Dollar.
- Where Chicago’s Gentrification Signals Are Active: East Garfield Park, New City and North Lawndale Show Four of Five. Logan Square, Avondale and the Lower West Side Show None.