
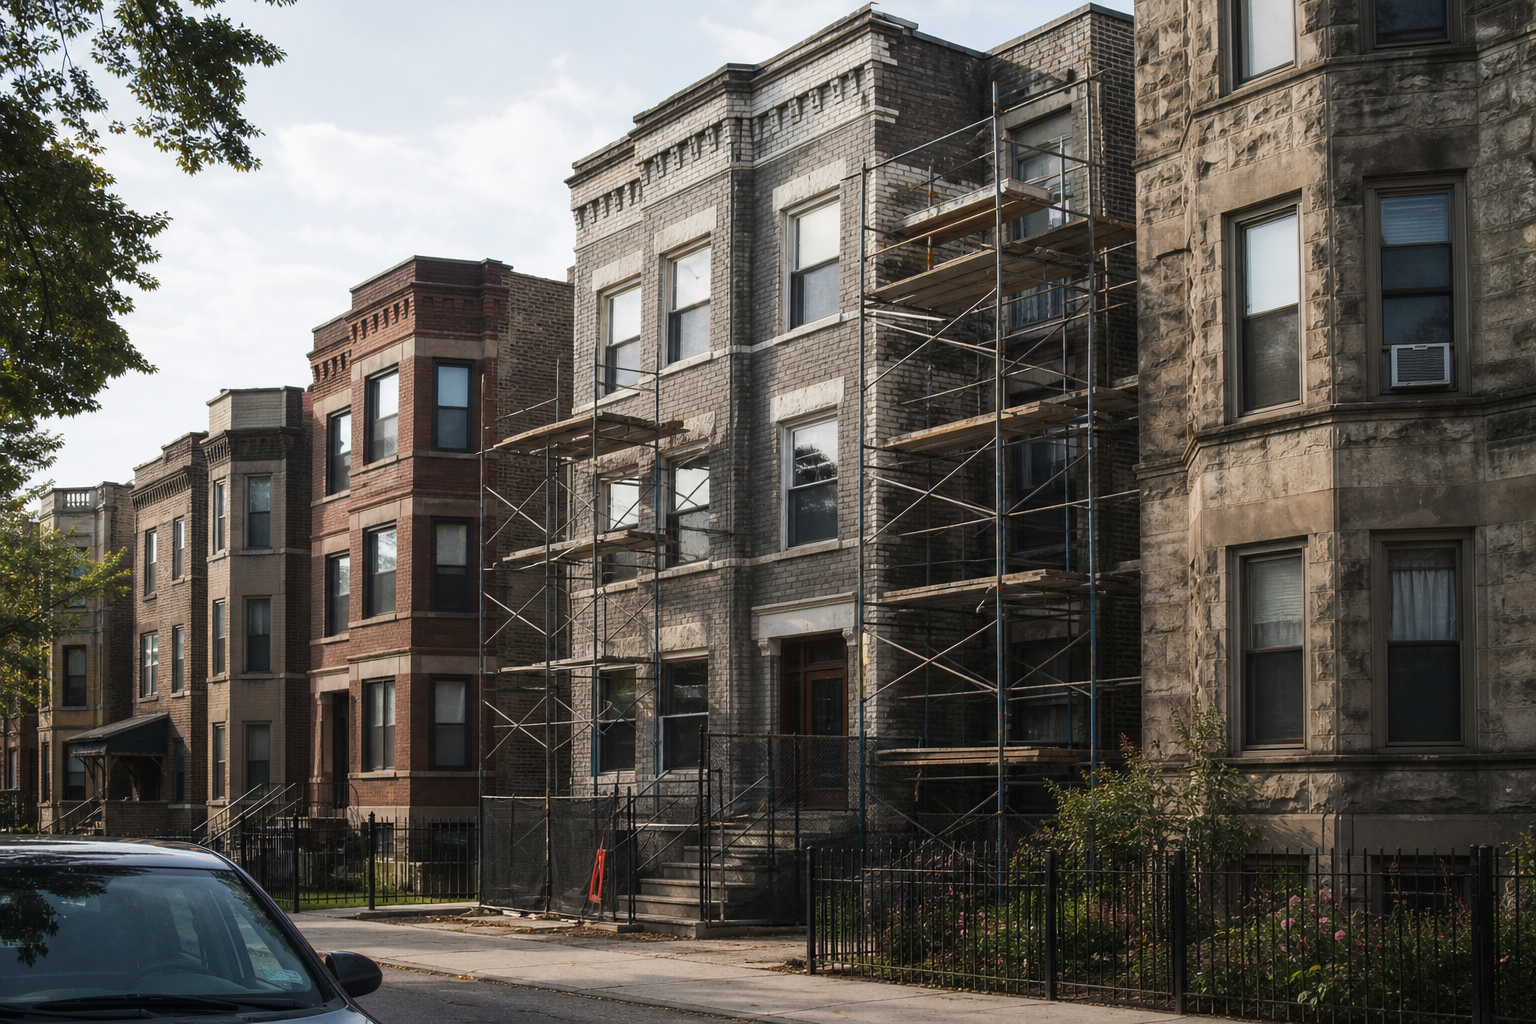

Three of Chicago’s 77 community areas show four of the five market signals this page tracks as markers of gentrification, the process in which investment and higher-income buyers move into a low-cost area and prices rise: East Garfield Park, New City and North Lawndale. Four more show three. Logan Square, Avondale and the Lower West Side, which takes in Pilsen, show none. The five signals are house prices rising fast from a below-median start, two-to-six-flat prices rising faster than the city’s, companies taking a growing share of purchases, new-construction permits rising, and new business licenses growing while the citywide count falls. Prices and licenses compare 2019 with 2025; buyers and permits compare 2018–19 with 2024–25. We read the signals as marks of where investment is arriving. They do not record who leaves.
Cook County Assessor sales file as updated September 15, 2026, 245,849 recorded home sales since 2018 · city building permits and business licenses · computed September 30, 2026Correction, September 30, 2026: when this page was published on July 18, 2026, it said that about one Chicago home purchase in six so far in 2026 had a company as the buyer, 16.1 percent, and called that the highest share in nine years of records. The figure covered January 1 through May 28, 2026, and was set against full years. Two things were wrong with it. Part of a year is not comparable with full years: in six of the eight full years in the file the company share was higher in the first quarter than over the whole year, and the file was still filling in. And the count of companies took in trustees. A home held in a land trust is recorded under the name of the trust company, and 1,050 such purchases since 2018 were counted as purchases by companies. The same window now holds 8,603 sales. Its share is 15.2 percent by the July method and 14.5 percent with trustees counted as trusts, which is the method this page now uses. Measured over January through May of every year, 2026’s 14.4 percent is below 2019’s 15.4 and 2018’s 15.3, and the highest full-year share is 2018’s 15.1 percent; 2025’s is 14.8. The county has also added 28 percent more 2025 sales to its file since July. Together the changes altered 16 signals in 13 areas, listed near the end of this page. North Lawndale now shows four signals where it showed three, and Hermosa shows none where it showed two.
The five signals and how each is scored
- House pricesCitywide median house price: $230,000 in 2019, $320,000 in 2025. Active where an area started below the 2019 citywide median and its 2025 median is at least 1.60 times its 2019 median, which is 1.15 times the citywide ratio.+39%
- Two-to-six-flat pricesCitywide median: $274,500 in 2019, $445,000 in 2025. Active where an area’s 2025 median is at least 1.78 times its 2019 median, which is 1.10 times the citywide ratio.+62%
- Company buyersCitywide share of 2025 home purchases with a company as the buyer. Active where an area’s share in 2024–25 was at least five points above its share in 2018–19, with 50 or more purchases in each period.14.8%
- New-construction permitsCitywide count: 3,433 in 2018–19, 2,703 in 2024–25. Active where an area had at least 1.5 times as many in the later period as in the earlier one, and at least eight.−21%
- New business licensesCitywide count of first-time licenses: 7,464 in 2019, 6,503 in 2025. Active where an area grew 15 percent or more, with at least 30 licenses in 2025.−13%
Two choices shape the scoring. The two price signals compare an area with the citywide rate of change, so an active price signal means prices there rose faster than in Chicago as a whole; the other three look at the area’s own change. And the house-price signal requires a start below the citywide median, because we read a fast rise from a low price as a market that new buyers are entering, and the same rise in an expensive area as appreciation. The thresholds are choices. They were set before the first version of this page and have not been changed; an area with too few sales, permits or licenses for a signal is left unmeasured for that signal.
Where the signals are active
Of the 77 community areas, 67 have enough records to measure at least three of the five signals. In 40 of those 67, none is active. Eight show one signal, twelve show two, four show three and three show four. No area shows all five. The remaining 10 areas are gray on the map because fewer than three signals could be measured there.
Where are the seven areas with three or four? All lie west or south of downtown: East Garfield Park and North Lawndale on the West Side, and New City, West Englewood, Greater Grand Crossing, Auburn Gresham and South Chicago to the south. On the North and Northwest Sides, Lincoln Park, Lake View, Uptown, Edgewater, Rogers Park, West Town, Logan Square, Avondale and Irving Park each show no active signal or one.
The three areas with four signals
East Garfield Park. The median house sale rose from $168,500 in 2019 to $295,000 in 2025, up 75 percent from a start well below the citywide median. The median two-to-six-flat went from $199,000 to $370,000. New-construction permits rose from 17 in 2018–19 to 64 in 2024–25. New business licenses went from 53 to 66 a year while the citywide count fell 13 percent. The one signal that is not active is company buying, which rose from 22 to 26 percent of purchases, short of the five-point threshold.
New City. The community area that contains Back of the Yards shows house prices up 82 percent, from $115,500 to $210,000, and two-to-six-flat prices doubled, from $115,000 to $230,000. Companies went from 11 to 17 percent of buyers. New business licenses rose from 80 to 214 a year, the largest proportional increase of any area with enough licenses to score. The license count covers every kind of business, industrial as well as retail. Permits are the signal that is not active: 44 in the earlier period and 59 in the later one.
North Lawndale. Two-to-six-flats more than doubled, from $175,000 to $377,500. Companies rose from 22 to 29 percent of buyers. New-construction permits went from 27 to 104; a permit is not a housing unit. Why does North Lawndale show four signals now and three in July? Its house-price signal turned on as the county recorded more 2025 sales. In July the 2025 median was $127,500 on 40 recorded house sales, a rise too small to count. With 53 sales recorded, the median is $168,000, up 60 percent from $105,000 in 2019. That is exactly the line: the signal needs a 2025 median 1.60 times the 2019 median, and North Lawndale’s is 1.60 times. A few more recorded sales could move the median off that line in either direction, and with it the area’s count of four. New business licenses fell, from 56 to 43, and are the signal that is not active.
The four areas with three signals
West Englewood has the steepest price change in the city on this measure. Its median house sale went from $40,000 in 2019 to $152,500 in 2025, and its median two-to-six-flat from $63,000 to $220,000. Companies rose from 14 to 21 percent of buyers. Our reading of a median that starts at $40,000: part of the rise is the end of distressed sales at very low prices, and the file cannot separate that from houses gaining value. Permits there were too few to measure.
Greater Grand Crossing, Auburn Gresham and South Chicago each show the two price signals and the permit signal. House medians went from $75,000 to $150,000 in Greater Grand Crossing, from $97,000 to $180,000 in Auburn Gresham, and from $71,600 to $137,450 in South Chicago. The permit signal in all three rests on small numbers: 10 permits rising to 15, 6 to 15, and 4 to 10. In none of the three did the company share of buyers rise by five points, but it was already high: 32 percent of 2024–25 purchases in Greater Grand Crossing, 29 percent in Auburn Gresham and 32 percent in South Chicago.
Logan Square, Avondale and the Lower West Side show none
In Logan Square, Avondale and the Lower West Side, house prices rose faster than the city’s 39 percent, and each scores zero of five here. Why? Their prices started above the citywide median, which the price signal excludes by design, and no other signal is active in any of the three. Logan Square’s median house went from $655,000 to $952,375, Avondale’s from $437,500 to $694,500, and the Lower West Side’s from $325,000 to $523,750. New-construction permits fell in all three: 194 to 98 in Logan Square, 59 to 34 in Avondale and 80 to 61 on the Lower West Side. Our reading of that pattern: what the records show in these three areas now is an expensive market getting more expensive. The file starts in 2018, so it cannot date any earlier change there.
One earlier change nearby is documented. It runs along The 606, the elevated Bloomingdale Trail that opened in 2015 on the southern edge of Logan Square. DePaul University’s Institute for Housing Studies found that buyers paid a premium of about 22 percent for homes within a fifth of a mile of the trail’s western half, and later reported that prices for one-to-four-unit buildings in the lower-income parts of that half rose nearly 344 percent from 2012 to 2018, eroding the supply of lower-cost two-to-four-flats. The flats signal on this page is built to catch that kind of repricing while it is under way.
Woodlawn shows two signals, both about price
Woodlawn’s median house sale went from $114,678 in 2019 to $347,500 in 2025, on 39 recorded house sales that year, and its median two-to-six-flat from $190,000 to $462,000. The other three signals are not active. Companies were 26 percent of buyers in the earlier period and 26 percent in the later one. Permits rose from 67 to 85, short of the threshold, and new business licenses fell from 42 to 35. The Obama Presidential Center, in Jackson Park at the area’s eastern edge, was dedicated on June 18, 2026. The price change measured here ends with 2025 sales, so all of it came before the Center opened.
Woodlawn is also an area where the city legislated ahead of the change. The Woodlawn Housing Preservation Ordinance, adopted by the City Council in September 2020, requires affordable units in projects on a quarter of the city-owned vacant land there, funds the purchase and repair of vacant buildings and a homeownership program, and gives tenants of larger buildings a right of first refusal when a landlord sells. We have not found a published evaluation of how those tools performed as prices rose.
Who is buying: the company share of purchases
| Year | Full year | January–May |
|---|---|---|
| 2018 | 15.1% | 15.3% |
| 2019 | 14.1% | 15.4% |
| 2020 | 11.1% | 13.8% |
| 2021 | 11.8% | 11.5% |
| 2022 | 13.1% | 12.5% |
| 2023 | 14.4% | 13.4% |
| 2024 | 13.5% | 13.7% |
| 2025 | 14.8% | 14.2% |
| 2026 | not yet | 14.4% |
Nearly every recorded sale carries a buyer’s name, and sorting the names into companies, trusts, banks and government bodies, and people gives the table above. (427 of the 245,849 sales have no buyer name, most of them in the newest months; they are counted as not being companies.) The company share of purchases fell from 15.1 percent in 2018 to 11.1 percent in 2020 and has climbed since, to 14.8 percent in 2025, which is still 0.3 points below 2018. The 2025 figure can still move, because the county is still recording 2025 sales. Trusts moved the other way, from 1.7 percent of purchases in 2018 to 4.2 percent in 2025.
Why give January through May its own column? Because a part-year figure cannot be set beside full years: the share moves with the seasons. It was lowest in the second quarter in six of the eight full years and highest in the fourth quarter in five. On equal terms, 2026’s 14.4 percent ranks third of nine, behind 2019 and 2018, and it can still change. The table stops at May because the newest records are not yet a fair sample of buyers. Of the 890 sales dated June 2026 in the file, two name a company as the buyer and 148 carry no buyer name at all; of the 194 dated July, none names a company. The file does not say why its newest records look like this, and we do not guess.
What companies buy differs by type of home. Among condominiums their share fell, from 12 percent of purchases in 2018–19 to 6 percent in 2024–25. Among houses it rose from 13 to 16 percent. Among two-to-six-flats it rose from 24 to 27 percent, so more than one in four of the small apartment buildings sold in Chicago in 2024–25 went to a company. Most of the fall among condominiums is one kind of purchase, units bought by a company that took five or more in the same building: 1,798 in 2018–19 and 102 in 2024–25, by our count of condominium buildings bought in bulk. Outside those, companies bought 1,180 condominiums in the first period and 1,162 in the second.
Company buying is also uneven across the city, and it did not arrive on the South Side recently. In Washington Park companies were 38 percent of buyers in 2018–19 and 35 percent in 2024–25; in Greater Grand Crossing, 34 and 32 percent. The signal on this page looks for growth, and it is active in 11 areas. The largest shares among them are in Burnside, up from 25 to 39 percent on 70 purchases in the later period, Chatham, up from 28 to 35 percent, and Avalon Park, up from 23 to 31. In Uptown the share fell from 16 to 7 percent.
A note on the sorting. A name counts as a company when it carries a marker such as LLC, Inc. or Corp. Trusts are counted separately, because many Chicago families hold their homes in ordinary land trusts; a name with the word trust or trustee in it counts as a trust even when the trustee is itself a company. Banks and government bodies are a third group. Some investors buy through trusts, so the company share understates investor buying by an amount these records cannot show.
What changed since the July reading
| Area and signal | July | Now |
|---|---|---|
| Belmont Cragin: company buyers | active | not active |
| Douglas: house prices | not measured | not active |
| Dunning: two-to-six-flat prices | not measured | not active |
| Gage Park: house prices | active | not active |
| Hegewisch: company buyers | active | not active |
| Hermosa: two-to-six-flat prices | active | not active |
| Hermosa: company buyers | active | not active |
| Lincoln Square: company buyers | active | not active |
| North Center: company buyers | active | not active |
| North Lawndale: house prices | not active | active |
| North Park: two-to-six-flat prices | not measured | not active |
| North Park: company buyers | active | not active |
| Uptown: two-to-six-flat prices | not active | active |
| Washington Heights: house prices | active | not active |
| Washington Heights: two-to-six-flat prices | not measured | not active |
| West Garfield Park: house prices | not measured | active |
Sixteen signals in thirteen areas read differently now than in July. No threshold changed. Two other things did: the sorting of buyers, which now counts trustees as trusts, and the county’s file, which keeps adding sales for many months after they happen. 2025 had 19,720 recorded sales in the July reading and has 25,222 now. Five of the changes are signals that had too few sales to measure in July. Seven are medians or shares that sat near a threshold and crossed it as more sales were recorded. The other four, the company signals in Belmont Cragin, Lincoln Square, North Center and North Park, come from counting trustees as trusts: in those four areas the rise that July counted as company buying no longer reaches five points once trustees are taken out. Signals that flip near a threshold are a limit of any yes-or-no score, and that is why the counts on this page are a reading as of September 30, 2026. The 2025 sales year gets another reading in January 2027.
What the five signals cannot see
Everything above is read from sales, permits and licenses. The harm most often associated with gentrification is displacement, and those records do not show it: they do not record a family that moves when the rent rises, a building emptied before a sale, or a tenant whose lease is not renewed. This page has no eviction or lease records and makes no claim about displacement in any area. DePaul’s Institute for Housing Studies keeps a displacement-pressure map built for that question.
Rising prices also mean different things to different households in the same area. For an owner who stayed through decades of falling values, a higher sale price is equity returning. For a renter in the same kind of building, a sale at a higher price can be followed by a higher rent, which these records do not show. The signals show where sale prices and investment are rising and say nothing about rents or about how gains and costs are divided.
- Sales and buyers Cook County Assessor, Parcel Sales (wvhk-k5uv), as updated September 15, 2026: 245,849 recorded sales of houses, condominiums and two-to-six-flats in Chicago since January 2018 that pass the Assessor’s arms-length screens and cover a single parcel, each placed in a community area by its parcel’s coordinates. 3,522 sales of condominium parcels that the Assessor flags as parking spaces, storage units or common areas are left out. Buyer names are sorted by pattern, in this order: banks and government bodies, trusts and trustees, companies, and people.
- Permits City of Chicago building permits (ydr8-5enu), permit type “new construction,” all uses, pooled 2018–19 and 2024–25 by community area. A permit is not a housing unit.
- Licenses First-time business licenses (r5kz-chrr) by location, 2019 and 2025, from our license analysis, read in July 2026.
- Thresholds House prices: a 2019 median below the citywide $230,000 and a 2025 median at least 1.15 times the citywide ratio of 2025 to 2019, which works out to 1.60 times the area’s 2019 median, with 20 or more sales in each year. Flats: at least 1.10 times the citywide ratio, which works out to 1.78 times, same minimum. Company buyers: a share up at least five points, with 50 or more purchases in each period. Permits: at least 1.5 times the earlier count and at least eight in the later period, with ten or more across both. Licenses: growth of 15 percent or more with at least 30 in 2025. The map grays any area where fewer than three signals could be measured.
- What the score is The number of the five records that moved unusually fast in an area. It describes a market and does not establish that residents were displaced.
Computed by KCM Desk from the county sales file and city permit data read September 30, 2026, and license data read in July 2026. First published July 18, 2026; recomputed and rewritten September 30, 2026. Human-guided and edited — about this desk. If you spot an error, corrections come first.
Related Keep Chicagoland Moving coverage
- Chicago Housing, by the Numbers
- Who Is Buying Chicago? The Buyer’s Name on 245,849 Deeds: Companies Bought 13 Percent of Homes and 46 Percent of Those Resold Within Two Years
- What a Chicago Home Actually Sold For: 245,849 Deeds Since 2018, All 77 Community Areas
- Chicago’s Tax Rolls Show 7,875 Fewer Two-to-Six-Flats Than in 2006. Of the 13,049 Parcels That Left the Count, 6,208 Are Now Classed as Single-Family Houses.
- East Garfield Park, by the Numbers
- New City, by the Numbers
- North Lawndale, by the Numbers
- Logan Square, by the Numbers
- Lower West Side, by the Numbers
- Roseland, by the Numbers
- Auburn Gresham, by the Numbers
- South Shore, by the Numbers
- West Englewood, by the Numbers
- Woodlawn, by the Numbers
- Avondale, by the Numbers
- Englewood, by the Numbers
- Pullman, by the Numbers
- Near West Side, by the Numbers
- Austin, by the Numbers
- Humboldt Park, by the Numbers
- Greater Grand Crossing, by the Numbers
- South Chicago, by the Numbers
- Chatham, by the Numbers
- West Pullman, by the Numbers
- Hegewisch, by the Numbers
- North Center, by the Numbers
- Lincoln Park, by the Numbers
- Lake View, by the Numbers
- West Town, by the Numbers
- Near North Side, by the Numbers
- Edgewater, by the Numbers
- Uptown, by the Numbers
- Rogers Park, by the Numbers
- Hyde Park, by the Numbers
- Irving Park, by the Numbers
- Bridgeport, by the Numbers
- Grand Boulevard, by the Numbers
- Douglas, by the Numbers
- South Lawndale, by the Numbers
- Armour Square, by the Numbers
- Lincoln Square, by the Numbers
- Portage Park, by the Numbers
- Belmont Cragin, by the Numbers
- Washington Park, by the Numbers
- Calumet Heights, by the Numbers
- Avalon Park, by the Numbers
- Kenwood, by the Numbers
- Chicago’s Two Renter Ordinances, Side by Side: Neither Text Before the Council Requires Just Cause. They Differ on Fees, Deposits and the Registry.
- South Shore After the Obama Center: What the Data Shows and What the Law Doesn’t
- Chicago Licenses 1,000 Fewer New Businesses a Year Than Before the Pandemic. The Gap Is Downtown.