
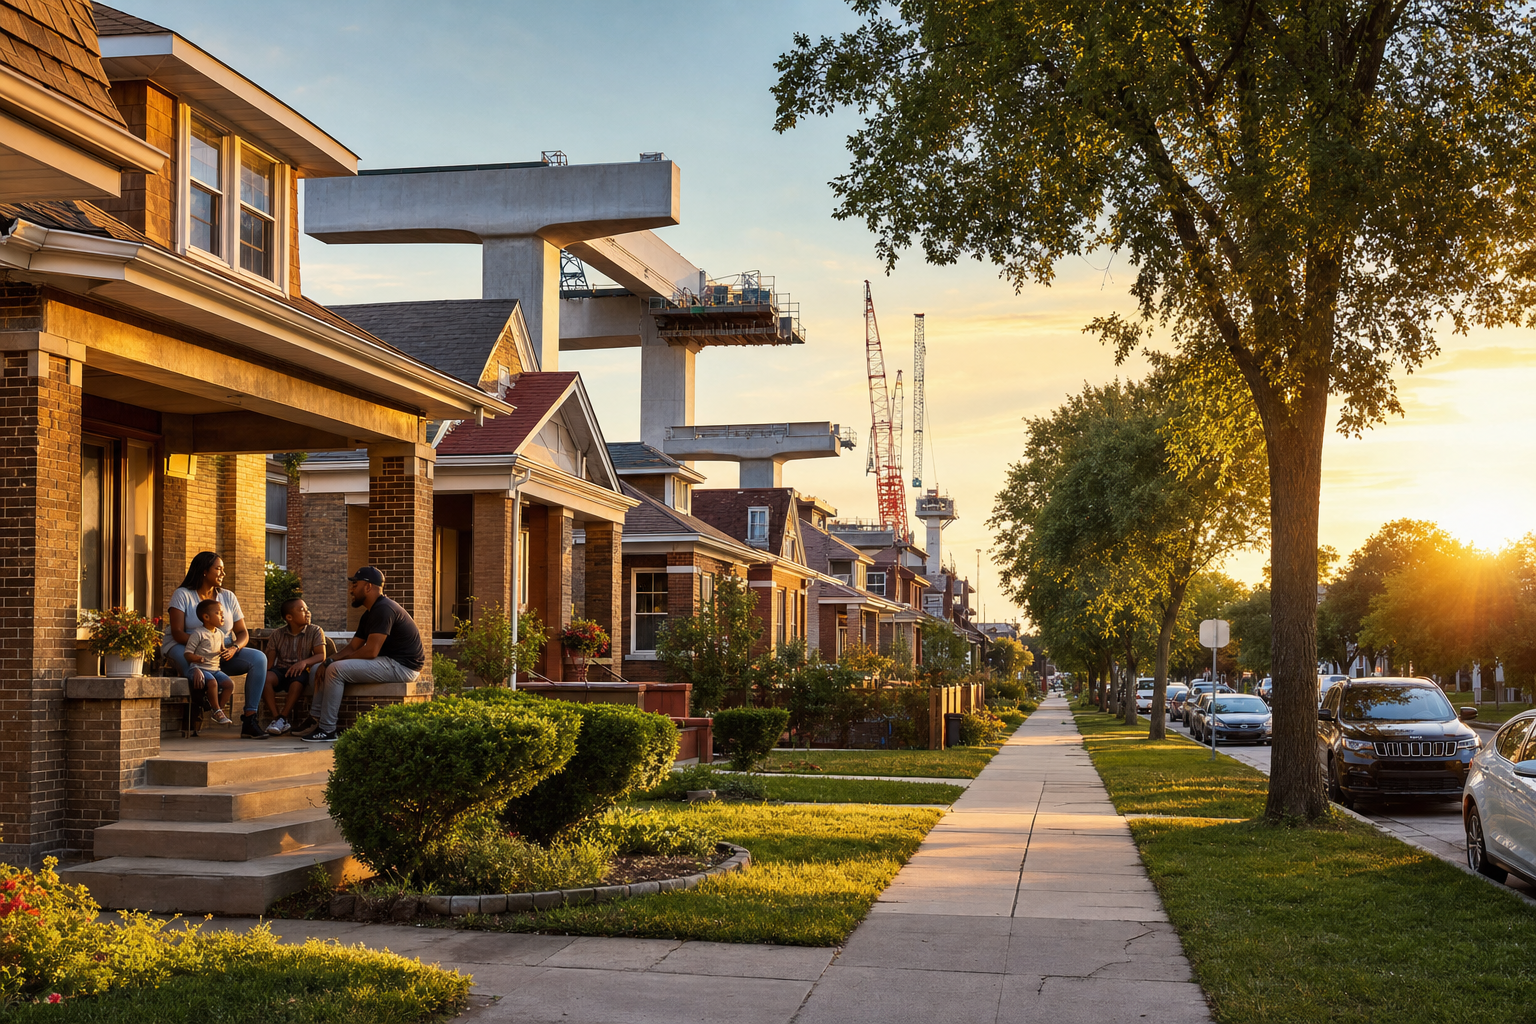

The CTA is extending the Red Line 5.5 miles south, from 95th/Dan Ryan to 130th Street, with four new stations. This page records the corridor’s numbers before any train runs, so that a later reading has a before to set beside it. In the three corridor areas with enough sales to measure, Roseland, West Pullman and Pullman, the median house price has at least doubled since 2019.
First recorded July 30, 2026 · read again September 30, 2026 on the county’s updated sales fileSecond reading and correction, September 30, 2026: the first version of this page called its figures frozen as of July 30, 2026. The county had not finished recording 2025 sales. Roseland had 366 recorded house sales for 2025 then and has 479 now, and its 2025 median is $144,000 where the first version printed $145,000. West Pullman’s is $142,500, printed $140,000. Pullman’s is unchanged at $178,000, now on 63 sales. Riverdale’s, on 14 sales, is $77,450, printed $130,000 on 11. The 2019 figures did not change. What is fixed on this page is the method. The 2025 figures get one more reading, in January 2027, and that reading is the one a follow-up will be compared against.
The project, from CTA’s project page as read on September 30, 2026, which describes “the 5.5-mile Red Line Extension”: the line runs from the existing terminal at 95th/Dan Ryan to 130th Street, with four new accessible stations near 103rd Street, 111th Street, Michigan Avenue and 130th Street. The page gives no opening date and this page repeats none from elsewhere. The corridor here means the four community areas the line and its station areas run through or border: Roseland, Pullman, West Pullman and Riverdale. That is our choice of map, stated so a follow-up uses the same one.
The corridor’s record before the extension
- Roseland468 house sales in 2019, 479 in 2025. Two new-construction permits in the first half of 2026.$70K$144K
- Pullman91 house sales in 2019, 63 in 2025. Two new-construction permits in the first half of 2026.$69K$178K
- West Pullman324 house sales in 2019, 346 in 2025. One new-construction permit in the first half of 2026.$67K$143K
- Riverdale12 house sales in 2019, 14 in 2025. No new-construction permits in the first half of 2026. Too few sales for a steady median.$37K$77K
Roseland, West Pullman and Pullman each had at least 63 house sales in 2025 and at least 91 in 2019. Riverdale had 12 and 14. Its median moved from $130,000 to $77,450 between the two readings of this page when three more sales were recorded, which is what a median on so few sales does. Its figures are shown for completeness.
House medians in three areas have at least doubled since 2019
Roseland’s median house sold for $70,000 in 2019 and $144,000 in 2025. West Pullman’s went from $67,450 to $142,500 and Pullman’s from $68,900 to $178,000: about twice the 2019 figure in Roseland and West Pullman and 2.6 times in Pullman. Citywide the median house went from $230,000 to $320,000, and every corridor median is still well below the citywide figure. None of this is attributed to the extension. These are the years before it opens, and house prices rose across the city in them.
Is the doubling a rise in what the same kind of house sells for? Only in part, on the record. In 2025, 216 of the 888 house sales in the three areas were of a house that had sold within the two years before, and those sold for far more than the rest. In Roseland the median resale was $258,500 and the median for the other sales was $116,000. Our reading: houses resold within two years are a large part of the rise in these medians. Whether those houses were renovated between sales cannot be determined from this file, and the 2019 sales cannot be split the same way because the file used here starts in 2018.
The terminal at 95th/Dan Ryan
95th/Dan Ryan is the end of the line today and the corridor’s bus-transfer point. It averaged 8,950 weekday entries in 2019, 4,511 in 2023 and 5,577 in 2025, which is 62 percent of the 2019 figure. Through May 31, 2026, the newest date in the file, the 2026 average was 5,604. When the four new stations open, their entries and the change at 95th are the first thing a follow-up will read.
What gets measured again when service begins
This page is a commitment about method. When the extension begins carrying riders, the same computations run on the same files under the same rules, and the results are published beside the figures recorded here. Five things are measured:
- House prices and sales countsThe median and the number of recorded house sales in each of the four areas, under the same rules for which sales count.4 areas
- House prices with resales set asideThe same median without houses resold within two years. In 2025: $116,000 in Roseland, $118,750 in West Pullman, $145,000 in Pullman.3 areas
- New-construction permitsPermits issued in each of the four areas, from the same city file. First half of 2026: five across the four.4 areas
- Weekday station entriesAt 95th/Dan Ryan and at each of the four new stations.5 stations
- New business licensesIn Roseland (62 in 2019, 40 in 2025) and West Pullman (32 and 20), the two corridor areas with enough licenses to report.2 areas
Showing that the extension caused any later change would take more than this page holds, starting with a comparison against similar areas away from the line. A follow-up that makes that claim will have to state its method when it makes it.
- Where the figures come from Apart from the split of 2025 sales into resales and other sales, nothing is measured separately for this page. House sales are from our analysis of recorded sale prices, on the county’s sales file as updated September 15, 2026. Permits are from our half-year permit count, licenses from our license analysis, and station entries from the CTA ridership files behind our transit analyses.
- The corridor Roseland, Pullman, West Pullman and Riverdale. Station locations are as CTA’s project page gives them, near 103rd Street, 111th Street, Michigan Avenue and 130th Street. The assignment to community areas is ours.
- Resales A 2025 sale counts as a resale when the same parcel has an earlier sale in the file no more than 730 days before it.
- Riverdale 12 house sales in 2019 and 14 in 2025, too few for a steady median. Our gentrification-signals analysis does not score the area for the same reason.
- The two readings The first reading was taken on July 30, 2026 and this one on September 30, 2026. The county is still adding sales dated 2025, so the 2025 figures are read once more in January 2027.
- What this page does not claim That the extension is changing the corridor. It records the figures a later reading can be tested against, whichever way they move.
Assembled by KCM Desk from Cook County and City of Chicago records. First published August 1, 2026, on figures recorded July 30, 2026; read again and rewritten September 30, 2026. Human-guided and edited — about this desk. If you spot an error, corrections come first.
Related Keep Chicagoland Moving coverage
- Chicago Transit, by the Numbers
- Chicago Housing, by the Numbers
- Roseland, by the Numbers
- Pullman, by the Numbers
- West Pullman, by the Numbers
- Chicago Houses and Two-to-Six-Flats Sold in 2025 Were Valued at 81 Percent of Their Sale Prices. Those Resold Within Two Years, at 60 Percent.
- Where Chicago’s Gentrification Signals Are Active: East Garfield Park, New City and North Lawndale Show Four of Five. Logan Square, Avondale and the Lower West Side Show None.
- Riding the Red Line, 2001–2026: Every Station, One Scroll